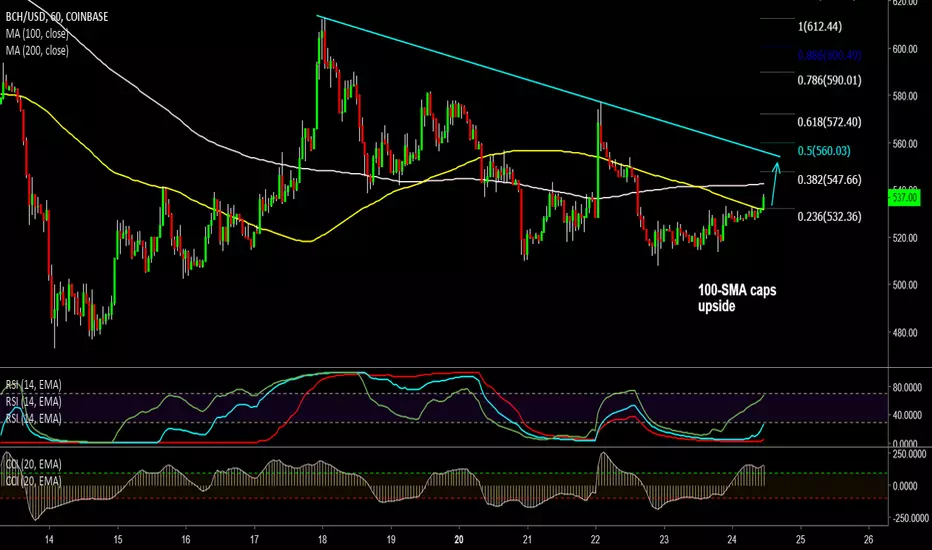
Bias on the daily chart is neutral, but we see scope for some upside on the hourly charts.
On 1H charts, momentum studies have turned bullish and RSI has edged above 50 mark with scope to run further.
Break above 1H 100-SMA will see next major hurdle at 1H 200-SMA at 542.
Breakout at 1H 200-SMA will see test of 38.2% Fib at 547 ahead of major trendline resistance at 556.
On 1H charts, momentum studies have turned bullish and RSI has edged above 50 mark with scope to run further.
Break above 1H 100-SMA will see next major hurdle at 1H 200-SMA at 542.
Breakout at 1H 200-SMA will see test of 38.2% Fib at 547 ahead of major trendline resistance at 556.
Disclaimer
The information and publications are not meant to be, and do not constitute, financial, investment, trading, or other types of advice or recommendations supplied or endorsed by TradingView. Read more in the Terms of Use.
Disclaimer
The information and publications are not meant to be, and do not constitute, financial, investment, trading, or other types of advice or recommendations supplied or endorsed by TradingView. Read more in the Terms of Use.