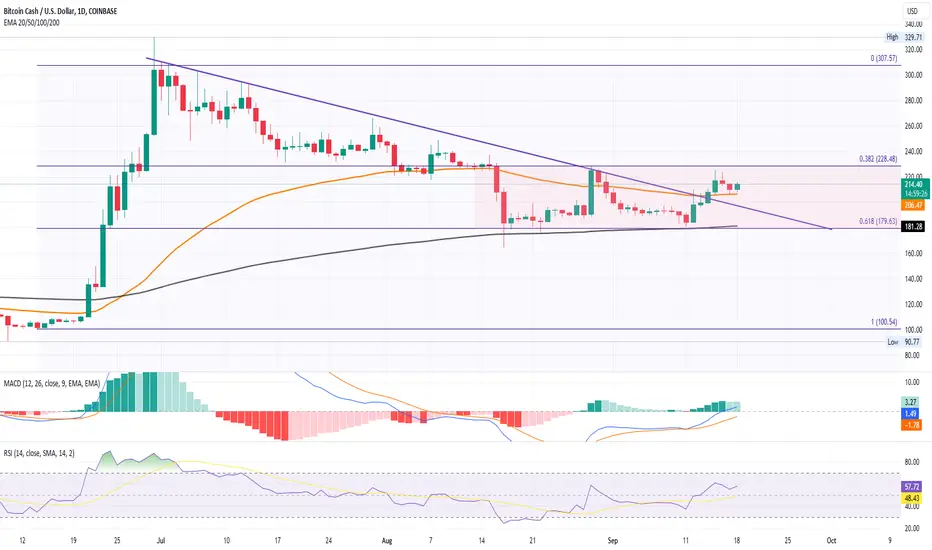
50-day EMA: A key technical indicator that averages the closing prices of an asset over the last 50 days. BCH recently tested this level for its resilience.
200-day EMA: Another crucial moving average that represents a longer timeframe. BCH had revisited this level, hovering around $180.
Resistance Trendline at $228: BCH faces a significant barrier at this price point, which might act as a hurdle before making further upward moves.
Death Cross: A technical pattern suggesting the potential for a significant selloff. It occurs when a short-term moving average crosses below a long-term moving average. BCH narrowly avoided this bearish signal.
RSI (Relative Strength Index): This momentum oscillator measures the speed and change of price movements. The RSI for BCH is approaching the 'overbought' territory, suggesting a bullish sentiment.
MACD (Moving Average Convergence Divergence): This trend-following momentum indicator shows the relationship between two moving averages of an asset's price. The widening gap suggests a bullish momentum for BCH.
Disclaimer
The information and publications are not meant to be, and do not constitute, financial, investment, trading, or other types of advice or recommendations supplied or endorsed by TradingView. Read more in the Terms of Use.
Disclaimer
The information and publications are not meant to be, and do not constitute, financial, investment, trading, or other types of advice or recommendations supplied or endorsed by TradingView. Read more in the Terms of Use.