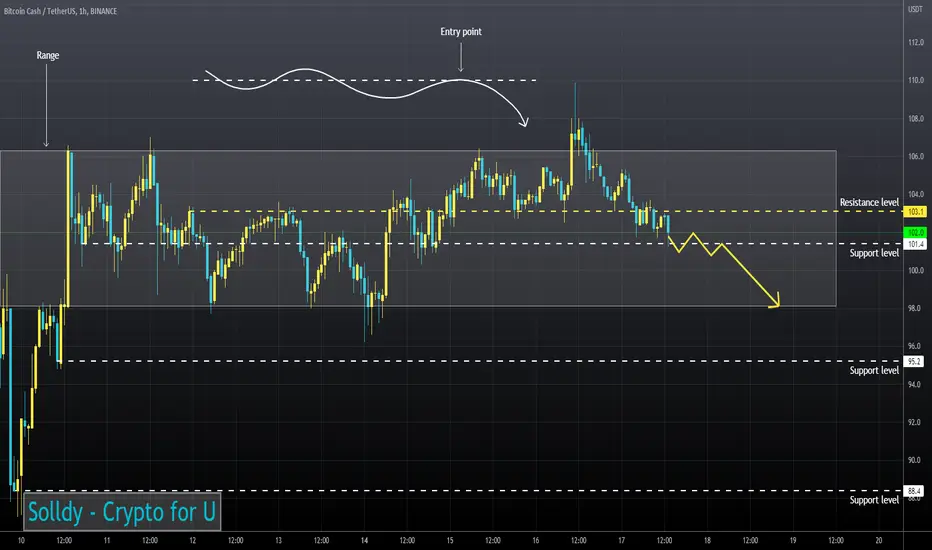
Bitcoin Cash is trading in the liquidity zone.
RSI chart is in the sellers zone (4H, 1H and 30m TFs)
At 30m Timeframe 50EMA and 200EMA form a "Death Cross"
I expect a fall should the price fix below the indicated support level.
RSI chart is in the sellers zone (4H, 1H and 30m TFs)
At 30m Timeframe 50EMA and 200EMA form a "Death Cross"
I expect a fall should the price fix below the indicated support level.
Related publications
Disclaimer
The information and publications are not meant to be, and do not constitute, financial, investment, trading, or other types of advice or recommendations supplied or endorsed by TradingView. Read more in the Terms of Use.
Related publications
Disclaimer
The information and publications are not meant to be, and do not constitute, financial, investment, trading, or other types of advice or recommendations supplied or endorsed by TradingView. Read more in the Terms of Use.