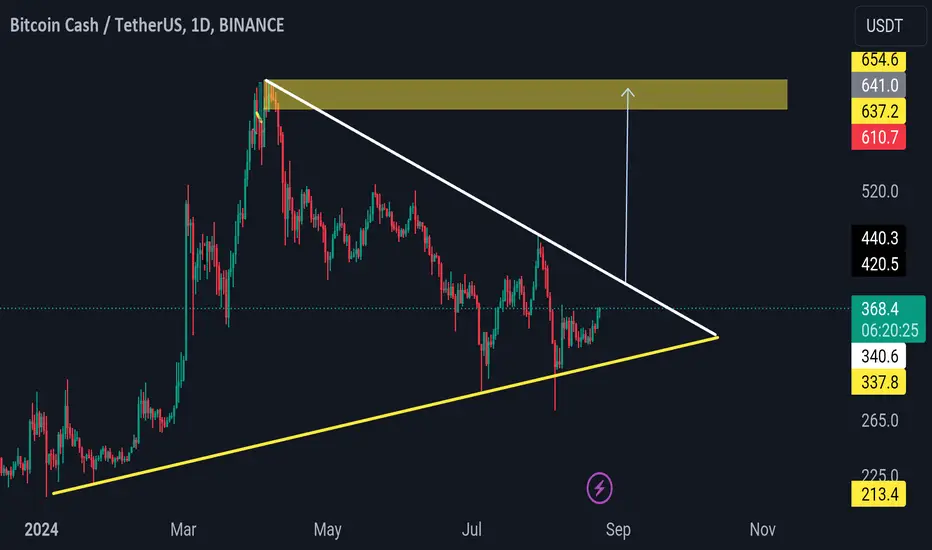
The symmetrical triangle pattern forming on the daily chart for BCH/USDT suggests a potential upcoming breakout. Buyers appear to be gaining interest, indicating a potential bullish move in the short term once the breakout occurs. However, trading patterns are complex, and outcomes are never guaranteed. It's always important to conduct thorough research and analysis to make informed trading decisions. Keep an eye on the chart for confirmation of the breakout before considering any trading actions.
Disclaimer
The information and publications are not meant to be, and do not constitute, financial, investment, trading, or other types of advice or recommendations supplied or endorsed by TradingView. Read more in the Terms of Use.
Disclaimer
The information and publications are not meant to be, and do not constitute, financial, investment, trading, or other types of advice or recommendations supplied or endorsed by TradingView. Read more in the Terms of Use.