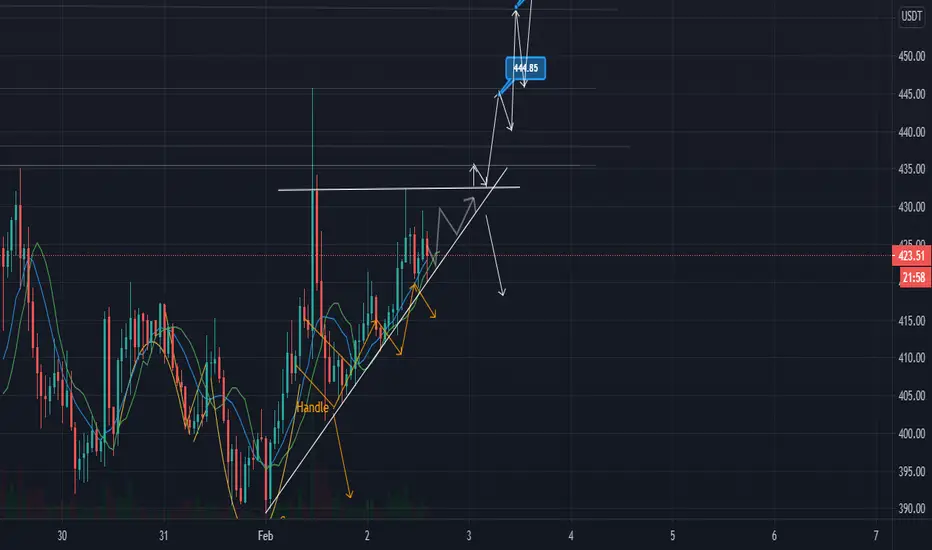
Ascending Triangle pattern seen in  BCH in 1hr Time Frame
This pattern could moveBCH up to $444 to $456 to $466...
my last chart onBCH which was the Cup & Handle already breakout!
looks like this pattern already breakout too on RRSR if you will look at my chart on it...
it seemBCH is imitating the move of RRSR
TYOR..
becareful!
This pattern could move
my last chart on
looks like this pattern already breakout too on RRSR if you will look at my chart on it...
it seem
TYOR..
becareful!
Trade closed: target reached
First target reached $444 was february 3...will do some chart on BCH again later
Disclaimer
The information and publications are not meant to be, and do not constitute, financial, investment, trading, or other types of advice or recommendations supplied or endorsed by TradingView. Read more in the Terms of Use.
Disclaimer
The information and publications are not meant to be, and do not constitute, financial, investment, trading, or other types of advice or recommendations supplied or endorsed by TradingView. Read more in the Terms of Use.