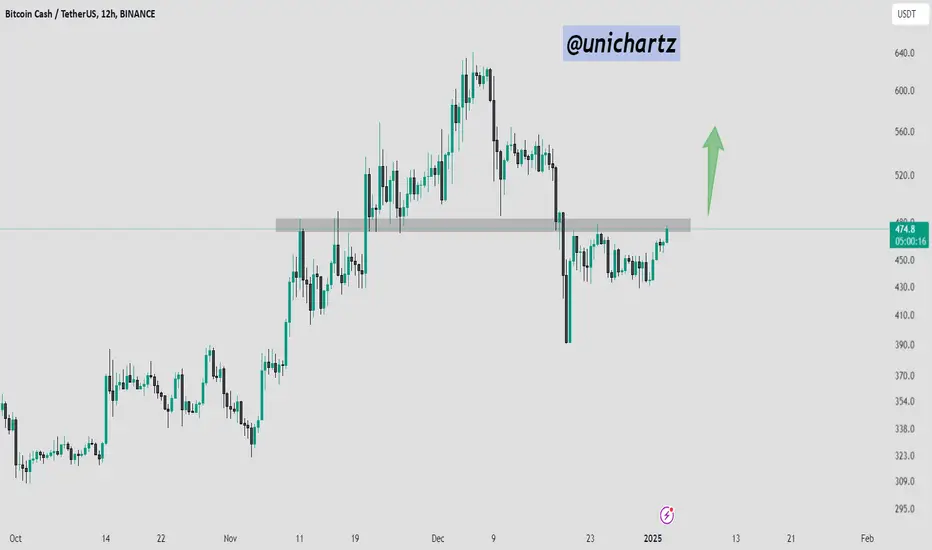
The BCH/USDT chart is showing bullish momentum as it approaches a critical resistance zone around $475-$480.
The price has reclaimed the $450-$460 support area, which previously acted as a strong demand zone, indicating a potential continuation of the upward trend.
DYOR, NFA
The price has reclaimed the $450-$460 support area, which previously acted as a strong demand zone, indicating a potential continuation of the upward trend.
DYOR, NFA
Disclaimer
The information and publications are not meant to be, and do not constitute, financial, investment, trading, or other types of advice or recommendations supplied or endorsed by TradingView. Read more in the Terms of Use.
Disclaimer
The information and publications are not meant to be, and do not constitute, financial, investment, trading, or other types of advice or recommendations supplied or endorsed by TradingView. Read more in the Terms of Use.