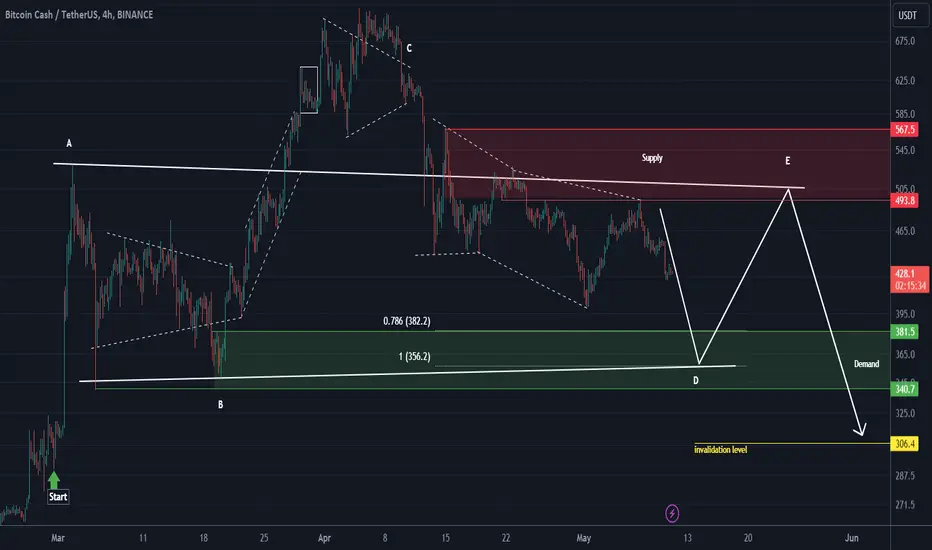
From where we put the "start" on the chart, it looks like a triangle is forming.
The depth of wave D is high, which strengthens the possibility of forming a triangle.
It is expected that we will have a return from the green range to the red range and then the main drop will occur
Closing the daily candle above the invalidation level violates the analysis
For risk management, please don't forget stop loss and capital management
Comment if you have any questions
Thank You
Trade active
It did not reach the green range but reacted to the red range and has dropped more than 13% so far.We have updated the triangle so that you can see it on the picture
🔆To succeed in trading, just enter our Telegram channel:
Free membership: t.me/Behdark_EN
🔷Our Telegram channel has daily spot and futures signals 👉 t.me/Behdark_EN
💎 Exclusive signals are only shared on our Telegram channel
Free membership: t.me/Behdark_EN
🔷Our Telegram channel has daily spot and futures signals 👉 t.me/Behdark_EN
💎 Exclusive signals are only shared on our Telegram channel
Disclaimer
The information and publications are not meant to be, and do not constitute, financial, investment, trading, or other types of advice or recommendations supplied or endorsed by TradingView. Read more in the Terms of Use.