Bitcoin Cash (BCH) technical analysis:
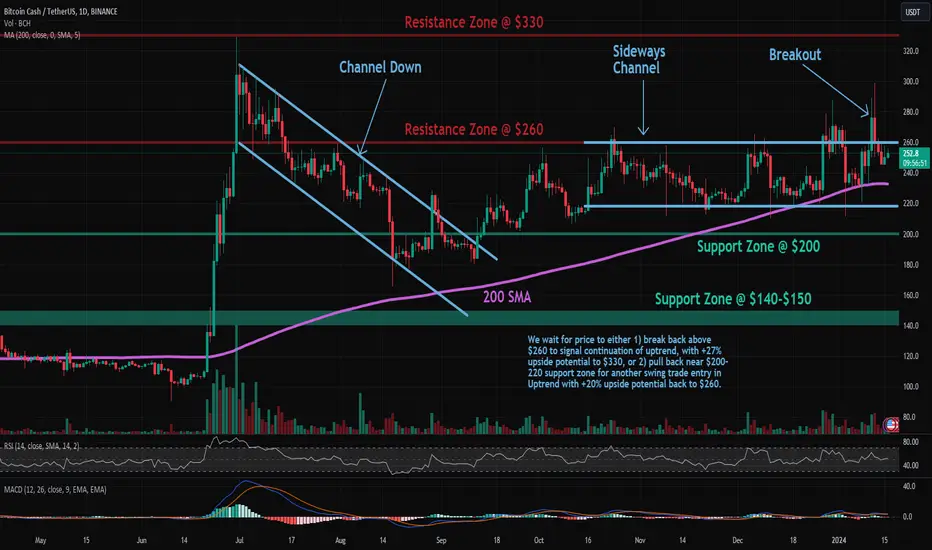
Trade setup: Price is in an uptrend. Following a bullish breakout from Sideways Channel ($218 – $260), above $260 resistance, price rallied 20% to $300, then pulled back to retest that breakout level. Now we wait for price to either 1) break back above $260 to signal continuation of uptrend, with +27% upside potential to $330, or 2) pull back near $200-220 support zone for another swing trade entry in Uptrend with +20% upside potential back to $260.
Trend: Uptrend across all time horizons (Short- Medium- and Long-Term).
Momentum is Mixed as MACD Line is below MACD Signal Line (Bearish) but RSI ~ 50 (Neutral).
Support and Resistance: Nearest Support Zone is $200 (previous resistance), then $140 – $150. The nearest Resistance Zone is $260, then $330.
Disclaimer
The information and publications are not meant to be, and do not constitute, financial, investment, trading, or other types of advice or recommendations supplied or endorsed by TradingView. Read more in the Terms of Use.
Disclaimer
The information and publications are not meant to be, and do not constitute, financial, investment, trading, or other types of advice or recommendations supplied or endorsed by TradingView. Read more in the Terms of Use.