Long
BCPT Elliot Waves (4 hour chart)
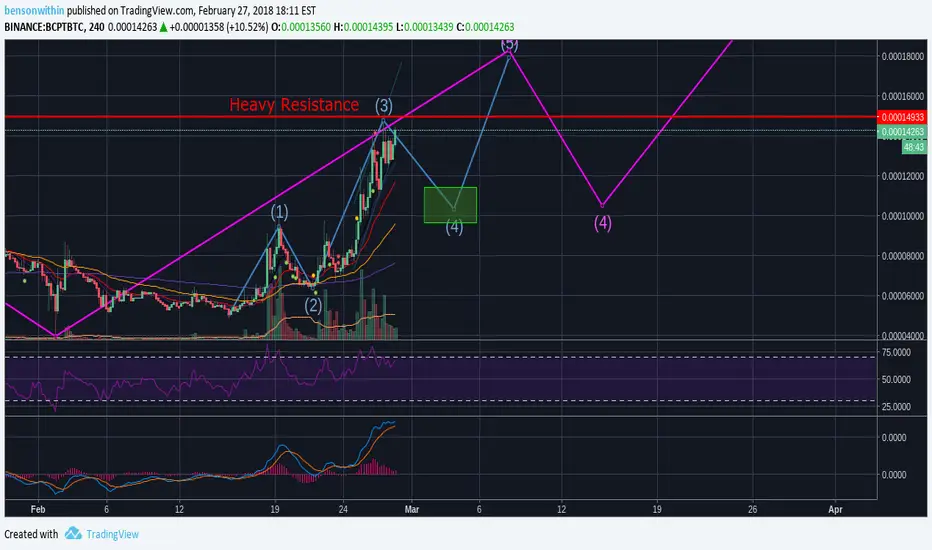
As you can see we are at the top of the third wave which is part of a larger series of Elliot waves that begin from late December. I've indicated the larger waves in purple. We are currently losing volume along with the histogram on the macd decreasing. The Rsi has touched the oversold territory twice so we can expect a break to the downside. I've placed a green rectangle to indicate my personal buy zone which is a 50
% retracement of wave 3.
% retracement of wave 3.
Disclaimer
The information and publications are not meant to be, and do not constitute, financial, investment, trading, or other types of advice or recommendations supplied or endorsed by TradingView. Read more in the Terms of Use.
Disclaimer
The information and publications are not meant to be, and do not constitute, financial, investment, trading, or other types of advice or recommendations supplied or endorsed by TradingView. Read more in the Terms of Use.