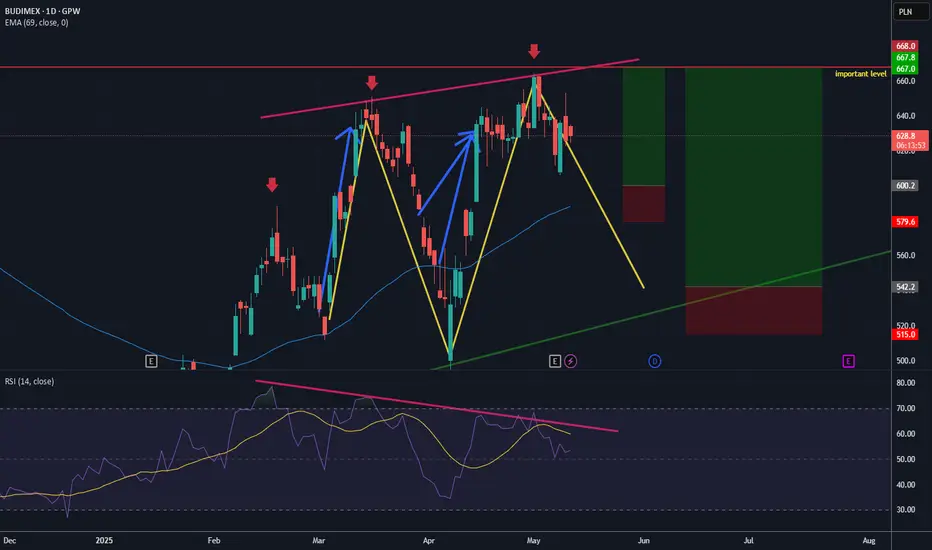
Price action (top chart):
The chart shows higher highs, indicated by the upward red arrows and pink trendline across the candle peaks.
RSI indicator (bottom chart):
The RSI (Relative Strength Index) shows lower highs, marked by a descending pink trendline.
🔍
This pattern is called a bearish divergence, where this can sometimes signal a potential reversal or slowdown in the uptrend.
Besides we are nearing the 660-670 which seems an important price resistance where you can see the selling.
I would like to see the M pattern to close somewhere around the bottom green line, which is a trendline from the Lows.
you can not see the EMA 33 (cause i can have only 2 at a time), but i will be buying first around 580-600, then averaging at the bottom trendline.
If it does not cross the 600 level, the setup is invalid
Note
Blue arrows were my previous transactionsDisclaimer
The information and publications are not meant to be, and do not constitute, financial, investment, trading, or other types of advice or recommendations supplied or endorsed by TradingView. Read more in the Terms of Use.
Disclaimer
The information and publications are not meant to be, and do not constitute, financial, investment, trading, or other types of advice or recommendations supplied or endorsed by TradingView. Read more in the Terms of Use.