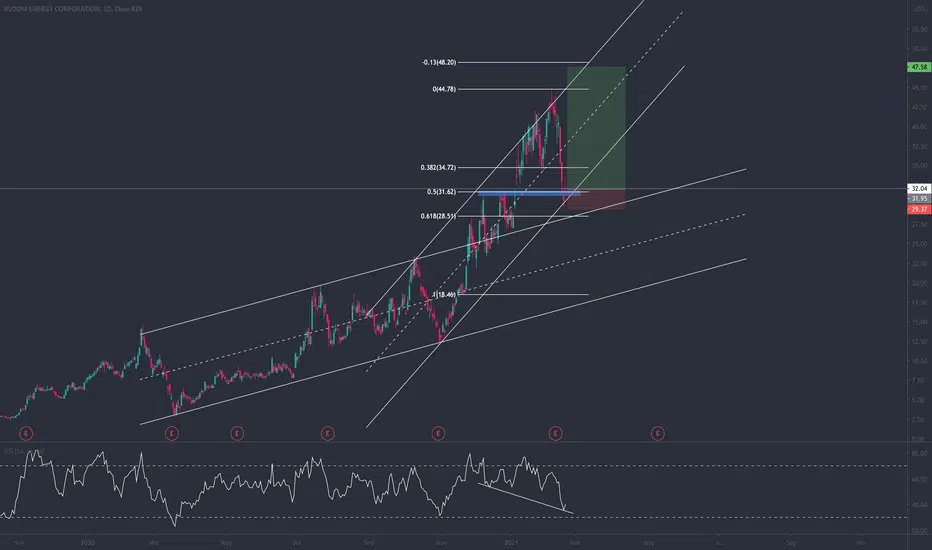
📈Price has recently gapped up above a strong resistance zone it had previously fallen below. Price has recently bounced from the support line of its bullish price channel it has been trading in since November - this occurred with a hammer candlestick which is a reversal candlestick. Price has also completed a 0.5 Fib retracement. Finally, there is some hidden bullish divergence, with the RSI making lower lows, but price making higher lows. If price continues its bullish trend to $47, this could see 48% upside.
🔎This is not financial advice. Always do your own research and due diligence. Always wait for directional confirmation before entering a trade.
Disclaimer
The information and publications are not meant to be, and do not constitute, financial, investment, trading, or other types of advice or recommendations supplied or endorsed by TradingView. Read more in the Terms of Use.
Disclaimer
The information and publications are not meant to be, and do not constitute, financial, investment, trading, or other types of advice or recommendations supplied or endorsed by TradingView. Read more in the Terms of Use.