Technical Analysis
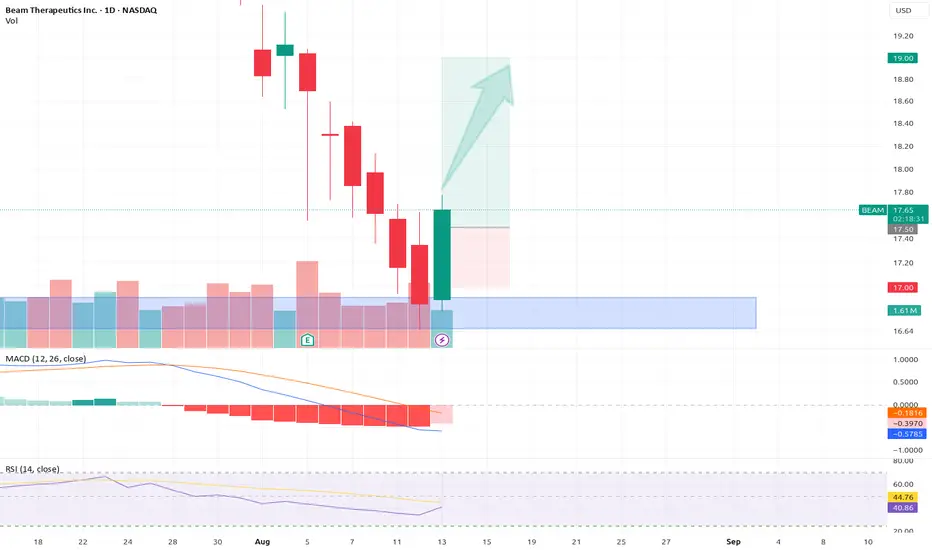
Instrument BEAM (Beam Therapeutics Inc.) – Daily/4H Chart
Key Support: Strong demand zone near $17, acting as a reversal level.
Indicators
MACD Bullish crossover above the zero line, signaling strengthening momentum.
RSI Bounced from ~50 (neutral), now trending upward without overbought conditions.
Structure Higher low formed at $17, suggesting a potential uptrend continuation.
Potential Scenarios
Bullish Breakout
If price holds above $17.50, next targets are $18.50 (resistance) and $19 (psychological level).
A close above $19 could extend gains toward $20.
Risk Management
Stop-Loss Below $17 (invalidates the reversal structure).
Take-Profit Scale out at $18.50 and $19.
Disclaimer
The information and publications are not meant to be, and do not constitute, financial, investment, trading, or other types of advice or recommendations supplied or endorsed by TradingView. Read more in the Terms of Use.
Disclaimer
The information and publications are not meant to be, and do not constitute, financial, investment, trading, or other types of advice or recommendations supplied or endorsed by TradingView. Read more in the Terms of Use.