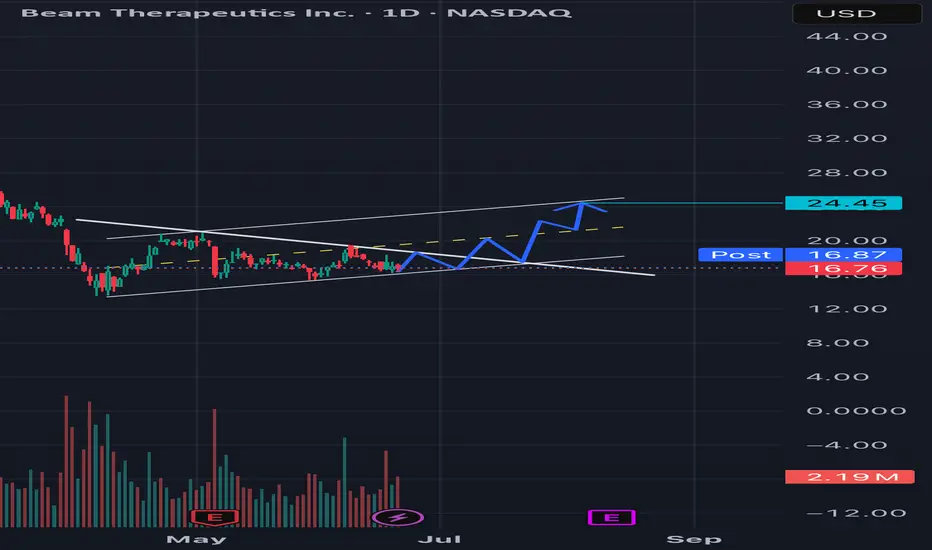
The stock chart for Beam Therapeutics Inc. (BEAM) displays an ascending triangle pattern, a bullish continuation signal. The target price of $24.45, marked on the chart, suggests a potential 45-46% upside, calculated by adding the triangle’s height (approximately $4.87) to the breakout level, with an expected path involving initial confirmation above $16.87, a steady rise toward $20.00, and further gains toward the target over days to weeks. Key resistance levels to watch are $20.00 and $22.00, with support at $16.87 and the rising trendline, though the stock’s movement may be influenced by market conditions, biotech sector trends, and company-specific news, with potential for volatility and pullbacks along the way.
Disclaimer
The information and publications are not meant to be, and do not constitute, financial, investment, trading, or other types of advice or recommendations supplied or endorsed by TradingView. Read more in the Terms of Use.
Disclaimer
The information and publications are not meant to be, and do not constitute, financial, investment, trading, or other types of advice or recommendations supplied or endorsed by TradingView. Read more in the Terms of Use.