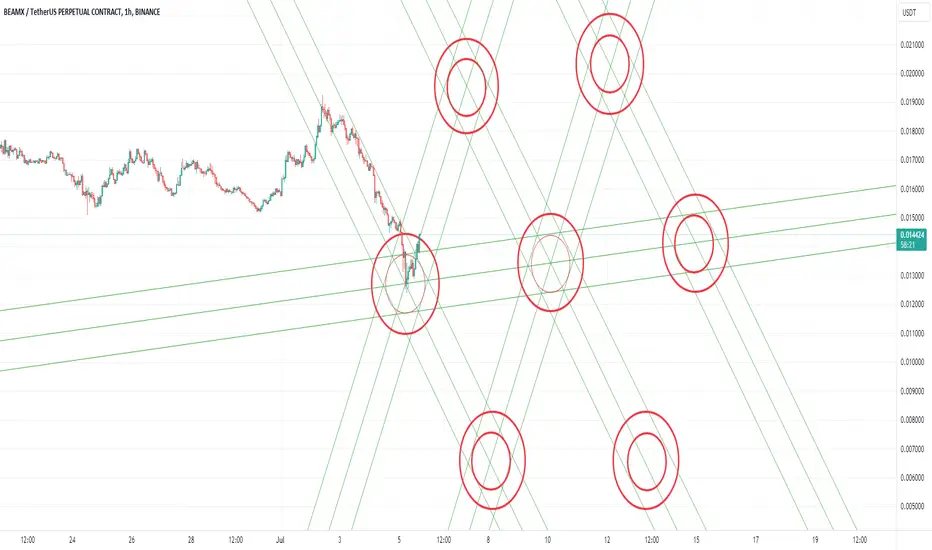
This is a chart using a method inspired by Da Vinci.
The circles are price targets and also these act like support and resistance trying to contain the price inside until it breaks out on the up side or down side. Also the diagonal lines are trend lines and they act the same.
This is not financial advice.
I can teach the method for those who see the benefit of it.
Trade active
Going good so far, here is an updated view in the different matter 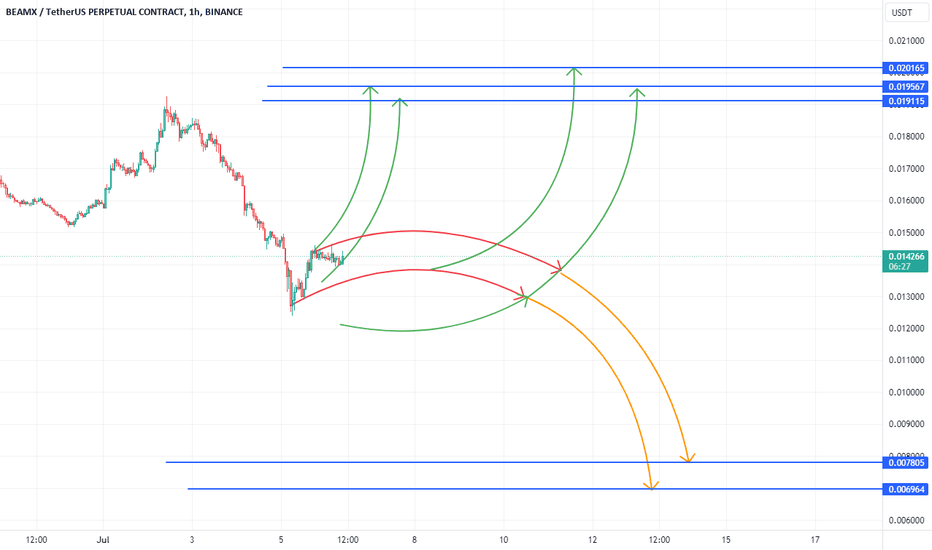
Disclaimer
The information and publications are not meant to be, and do not constitute, financial, investment, trading, or other types of advice or recommendations supplied or endorsed by TradingView. Read more in the Terms of Use.
Disclaimer
The information and publications are not meant to be, and do not constitute, financial, investment, trading, or other types of advice or recommendations supplied or endorsed by TradingView. Read more in the Terms of Use.