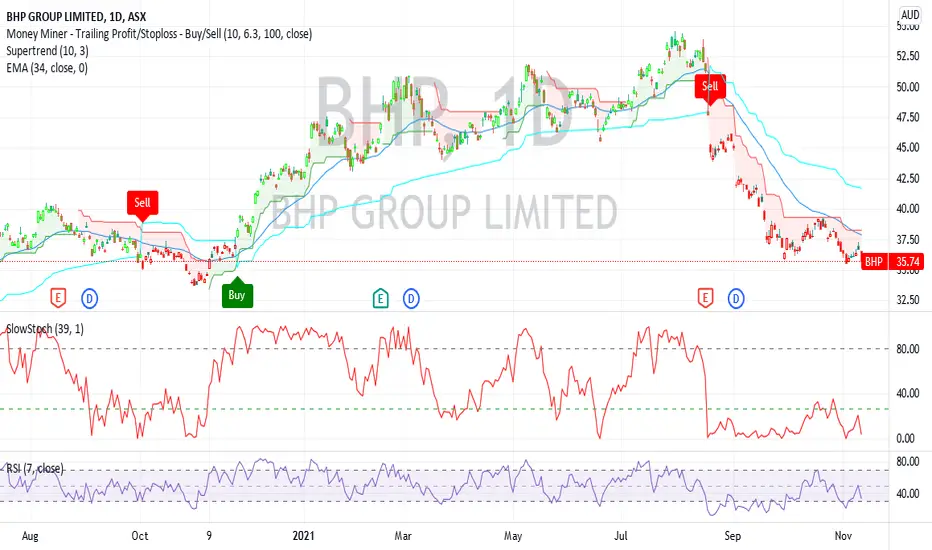
BHP.ASX has been in a steady decline but now seems to be forming a double bottom. When the RSI7 passes up above the 30 line, this gives an alert signal. Then watch for the slow stochastic 39,1 to pass above its 27 line as a buy signal within 6 weeks after the alert and then when the EMA39 flattens that confirms the buy. Not financial advise but to show how I set up my charts and do analysis. This arrangement is my unique chart setup which I have used for over 20 years.
Note
I changed the EMA39 to EMA34 (Fibonacci) but now use EMA21 as it generally results in entering the trade a bar or two earlier.Disclaimer
The information and publications are not meant to be, and do not constitute, financial, investment, trading, or other types of advice or recommendations supplied or endorsed by TradingView. Read more in the Terms of Use.
Disclaimer
The information and publications are not meant to be, and do not constitute, financial, investment, trading, or other types of advice or recommendations supplied or endorsed by TradingView. Read more in the Terms of Use.