Hi guys I get a lot of questions on what a 2-618 trade to find bottoms & tops, (longs & shorts) fairly simple set up & works in all time frames, typically higher times frame= more confluence, often more risk as well. Find supply/structure (LOOK LEFT!) typically they will be too far from moving averages and will be pulled back (gravitation) to 10 or 20 day.
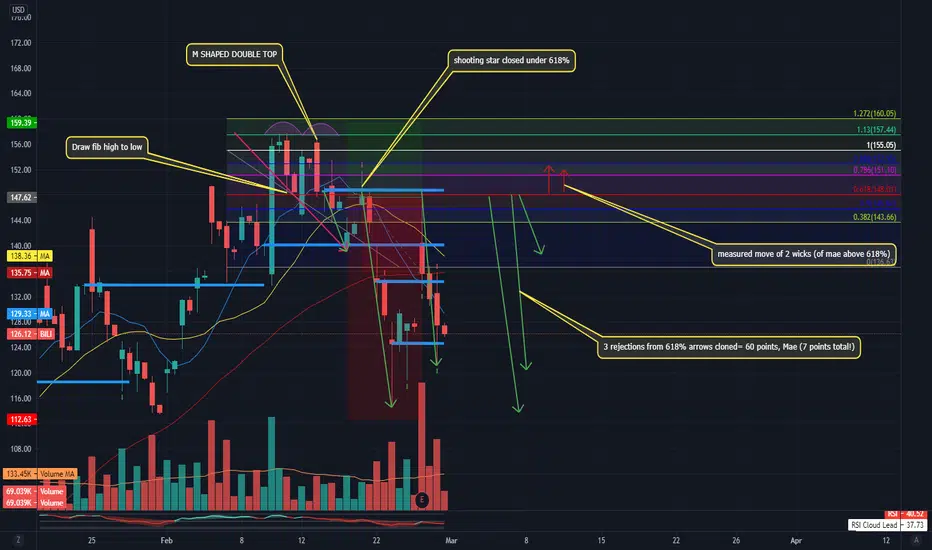
Find M shaped double top, let it make a break low. use fib to measure move high to low (red arrow) Sit and wait patiently at 618% level to short stop above high ( with price action ) , This is great example, Notice the shooting star candle that closed under 618% level, notice sellers creating rising volume bars i highlighted, this was institutional money cashing out imo. Notice the the moves (green arrows) which i cloned & added to right of pattern so you can risk to reward, (red arrows are mae or risk factor) More then mae, my favorite thing about my Mentors patterns, ( tntsunrise ) when they hit you are green a lot of times instantly often very ( up big $ w in seconds) , that's when you know your selling/buying w an edge, This plan paid 60 points on 3 trips from 618% with a total of 7 points in Mae in red, see contrast in arrows(cloned) on right red= measured move in red, green = measured move in profit, learn this it pays and very well, if you want to try to find this pattern & draw it, try JD, then compare with my JD plan i posted, it is the same exact play, you will start to see very often once you train your eyes.
Find M shaped double top, let it make a break low. use fib to measure move high to low (red arrow) Sit and wait patiently at 618% level to short stop above high ( with price action ) , This is great example, Notice the shooting star candle that closed under 618% level, notice sellers creating rising volume bars i highlighted, this was institutional money cashing out imo. Notice the the moves (green arrows) which i cloned & added to right of pattern so you can risk to reward, (red arrows are mae or risk factor) More then mae, my favorite thing about my Mentors patterns, ( tntsunrise ) when they hit you are green a lot of times instantly often very ( up big $ w in seconds) , that's when you know your selling/buying w an edge, This plan paid 60 points on 3 trips from 618% with a total of 7 points in Mae in red, see contrast in arrows(cloned) on right red= measured move in red, green = measured move in profit, learn this it pays and very well, if you want to try to find this pattern & draw it, try JD, then compare with my JD plan i posted, it is the same exact play, you will start to see very often once you train your eyes.
Disclaimer
The information and publications are not meant to be, and do not constitute, financial, investment, trading, or other types of advice or recommendations supplied or endorsed by TradingView. Read more in the Terms of Use.
Disclaimer
The information and publications are not meant to be, and do not constitute, financial, investment, trading, or other types of advice or recommendations supplied or endorsed by TradingView. Read more in the Terms of Use.