Hello friends,
Welcome to RK_Chaarts,
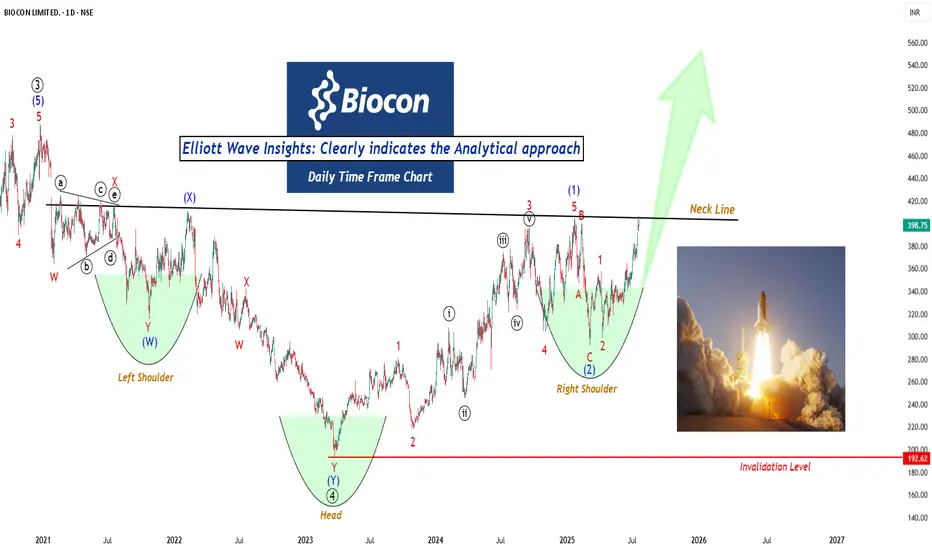
Today we're going to attempt to analyze the chart of Biocon Limited. Clearly, on the monthly timeframe, we can see that we've completed wave ((3)) and wave ((4)), which are of primary degree, marked on chart in Black color. We're currently unfolding wave ((5)), which will have five sub-divisions on the weekly timeframe. The weekly chart also shows that we've completed wave (1) and wave (2) of intermediate degree which we've marked in Blue, and wave (3) has begun, possibly indicating a breakout on the weekly chart. This breakout, having good intensity of Volumes.
Similarly, on the daily chart, we can see that we've completed sub-divisions red 1 and red 2 within wave (3), and possibly started red 3 of (3).
So, based on wave analysis, the outlook appears highly bullish, snapshots are shared below.
Possible Wave counts on Monthly

Possible wave counts on Weekly

Possible wave counts on Daily

The breakout is also accompanied by excellent volume. If we see a dip on lower timeframes, such as Hourly chart, and the price reaches a reliable moving average like the 50-EMA or 200-EMA, it could be a great opportunity to enter. Additionally, friends, we can see on the daily timeframe that a reversal chart pattern has formed and is on the verge of a breakout, with the price standing at the neckline. As soon as this breakout occurs, we can expect further additions. Snapshots are shared below.
Reversal and Bullish Chart Pattern: Inverted Head n Shoulder

Furthermore, we can see that the RSI on the weekly chart has also broken out and is above 60, indicating a strong bullish momentum. Even the MACD has shown a bullish positive crossover and is moving above the zero line on the weekly chart. Additionally, the monthly MACD is also displaying a strong bullish trend, having given a positive crossover and remaining above the zero line. These are all very positive signs. Snapshots are shared below.
RSI Breakout & above 60 on Weekly

MACD on Weekly

MACD on Monthly

We can see that on the weekly chart, the price has crossed above the major EMAs, including the 50, 100, and 200-period EMAs. Now, as the price moves towards its target, these three major moving averages are not obstacles, but rather support levels below. The fact that the price is moving above all these moving averages is a sign in itself.
Looking at the monthly timeframe, we can see that the price has also crossed above the 50, 100, and 200-period EMAs and is moving above them. This is a strong indication of the trend's strength and direction. Snapshots are shared below.
Ema monthly

Ema weekly

So, friends, if our Elliott Wave analysis is correct, and our roadmap is accurate, then as we can see, the monthly chart's wave ((3)), which is of primary degree, marked as rounded three in black, has completed its rounded ((4)) correction or retracement. Now, we're moving upwards towards wave ((5)).
If our wave count is correct, and the structure is right, then according to the theory, wave ((4))'s low, which is around 192, should not be breached. This level will serve as an invalidation level. If the price breaches the invalidation level of 192, which seems unlikely given the positive signs, our wave count will be invalidated, and we'll need to reanalyze it.
On the other hand, based on Elliott Wave theory, the projected target for wave ((5)) is typically between 123.6% and 161.8% of the length of wave ((4)). So, the price may reach or consolidate between the levels of 559 and 672, which are the projected targets based on wave theory, marking the end of wave ((5)) on the monthly chart.
This post is shared purely for educational purpose & it’s Not a trading advice.
I am not Sebi registered analyst.
My studies are for educational purpose only.
Please Consult your financial advisor before trading or investing.
I am not responsible for any kinds of your profits and your losses.
Most investors treat trading as a hobby because they have a full-time job doing something else.
However, If you treat trading like a business, it will pay you like a business.
If you treat like a hobby, hobbies don't pay, they cost you...!
Hope this post is helpful to community
Thanks
RK💕
Disclaimer and Risk Warning.
The analysis and discussion provided on in.tradingview.com/u/RK_Chaarts/ is intended for educational purposes only and should not be relied upon for trading decisions. RK_Chaarts is not an investment adviser, and the information provided here should not be taken as professional investment advice. Before buying or selling any investments, securities, or precious metals, it is recommended that you conduct your own due diligence. RK_Chaarts does not share in your profits and will not take responsibility for any losses you may incur. So Please Consult your financial advisor before trading or investing.
Welcome to RK_Chaarts,
Today we're going to attempt to analyze the chart of Biocon Limited. Clearly, on the monthly timeframe, we can see that we've completed wave ((3)) and wave ((4)), which are of primary degree, marked on chart in Black color. We're currently unfolding wave ((5)), which will have five sub-divisions on the weekly timeframe. The weekly chart also shows that we've completed wave (1) and wave (2) of intermediate degree which we've marked in Blue, and wave (3) has begun, possibly indicating a breakout on the weekly chart. This breakout, having good intensity of Volumes.
Similarly, on the daily chart, we can see that we've completed sub-divisions red 1 and red 2 within wave (3), and possibly started red 3 of (3).
So, based on wave analysis, the outlook appears highly bullish, snapshots are shared below.
Possible Wave counts on Monthly
Possible wave counts on Weekly
Possible wave counts on Daily
The breakout is also accompanied by excellent volume. If we see a dip on lower timeframes, such as Hourly chart, and the price reaches a reliable moving average like the 50-EMA or 200-EMA, it could be a great opportunity to enter. Additionally, friends, we can see on the daily timeframe that a reversal chart pattern has formed and is on the verge of a breakout, with the price standing at the neckline. As soon as this breakout occurs, we can expect further additions. Snapshots are shared below.
Reversal and Bullish Chart Pattern: Inverted Head n Shoulder
Furthermore, we can see that the RSI on the weekly chart has also broken out and is above 60, indicating a strong bullish momentum. Even the MACD has shown a bullish positive crossover and is moving above the zero line on the weekly chart. Additionally, the monthly MACD is also displaying a strong bullish trend, having given a positive crossover and remaining above the zero line. These are all very positive signs. Snapshots are shared below.
RSI Breakout & above 60 on Weekly
MACD on Weekly
MACD on Monthly
We can see that on the weekly chart, the price has crossed above the major EMAs, including the 50, 100, and 200-period EMAs. Now, as the price moves towards its target, these three major moving averages are not obstacles, but rather support levels below. The fact that the price is moving above all these moving averages is a sign in itself.
Looking at the monthly timeframe, we can see that the price has also crossed above the 50, 100, and 200-period EMAs and is moving above them. This is a strong indication of the trend's strength and direction. Snapshots are shared below.
Ema monthly
Ema weekly
So, friends, if our Elliott Wave analysis is correct, and our roadmap is accurate, then as we can see, the monthly chart's wave ((3)), which is of primary degree, marked as rounded three in black, has completed its rounded ((4)) correction or retracement. Now, we're moving upwards towards wave ((5)).
If our wave count is correct, and the structure is right, then according to the theory, wave ((4))'s low, which is around 192, should not be breached. This level will serve as an invalidation level. If the price breaches the invalidation level of 192, which seems unlikely given the positive signs, our wave count will be invalidated, and we'll need to reanalyze it.
On the other hand, based on Elliott Wave theory, the projected target for wave ((5)) is typically between 123.6% and 161.8% of the length of wave ((4)). So, the price may reach or consolidate between the levels of 559 and 672, which are the projected targets based on wave theory, marking the end of wave ((5)) on the monthly chart.
This post is shared purely for educational purpose & it’s Not a trading advice.
I am not Sebi registered analyst.
My studies are for educational purpose only.
Please Consult your financial advisor before trading or investing.
I am not responsible for any kinds of your profits and your losses.
Most investors treat trading as a hobby because they have a full-time job doing something else.
However, If you treat trading like a business, it will pay you like a business.
If you treat like a hobby, hobbies don't pay, they cost you...!
Hope this post is helpful to community
Thanks
RK💕
Disclaimer and Risk Warning.
The analysis and discussion provided on in.tradingview.com/u/RK_Chaarts/ is intended for educational purposes only and should not be relied upon for trading decisions. RK_Chaarts is not an investment adviser, and the information provided here should not be taken as professional investment advice. Before buying or selling any investments, securities, or precious metals, it is recommended that you conduct your own due diligence. RK_Chaarts does not share in your profits and will not take responsibility for any losses you may incur. So Please Consult your financial advisor before trading or investing.
YouTube: youtube.com/@rk_charts
Telegram : t.me/RK_Charts
Twitter : @charts_rk
Email : rkcharts@gmail. com
Disclaimer.
I am not sebi registered analyst.
My studies are for educational purpose only.
Telegram : t.me/RK_Charts
Twitter : @charts_rk
Email : rkcharts@gmail. com
Disclaimer.
I am not sebi registered analyst.
My studies are for educational purpose only.
Related publications
Disclaimer
The information and publications are not meant to be, and do not constitute, financial, investment, trading, or other types of advice or recommendations supplied or endorsed by TradingView. Read more in the Terms of Use.