Good Morning -- Happy Father's day to any dad's out there!
Let's took a weekly look at BITX -- our 2x leveraged
  BTCUSD fund.
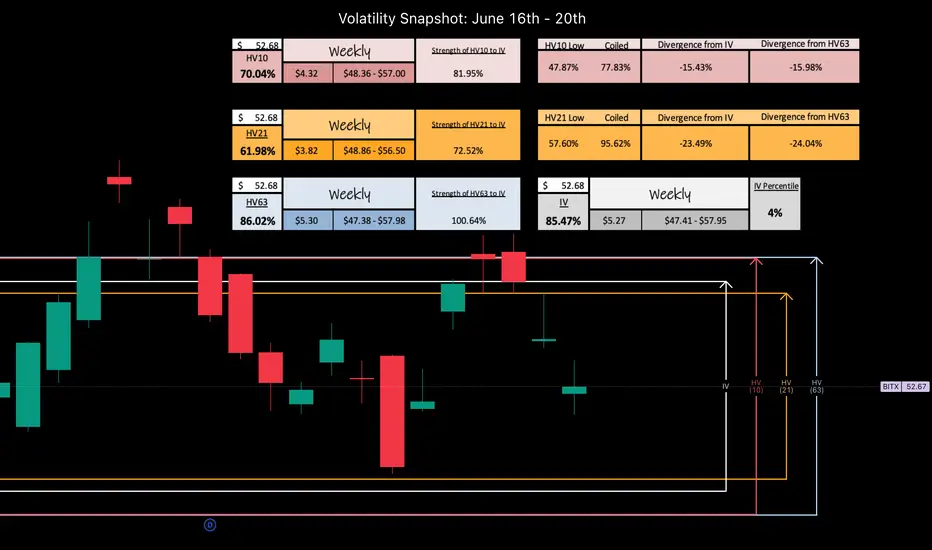
Last week, we saw a beautiful gap up to the upper HV63 implied ranges were profit was taken and accelerated selling begin. Our bi-weekly trending values have increased due to the increasing volatility. The weekly candle ended with some body to it, but was mostly flat due to the gap closing with a big wick up.
Our IV (85.47%) entering the week is trending within 4% of the sliding yearly lows and seemingly increasing as it tracks near-term trending markets -- HV10 (70.04%) has increased from the movement last week +7.35% and is now +22.17% off sliding yearly lows. As the spring is uncoiling, and bi-weekly regresses towards quarterly means our premium capture erodes and our range expands. I love trading volatility and ranges.
The 'strength of IV' here for HV10 is 82% -- so you have to account when positioning that the trending near-term volatility IS INCREASING but IS WEAKER than what is predicted. The 'strength of IV' here for HV63 is 101% -- showing that what is predicted is fairly valued to me on a regression scale.
Please -- Pull my chart onto your layout and use my implied ranges and data, follow along through the week on your own screen as we track and measure the volatility -- let's get this conversation started!
CHEERS
Let's took a weekly look at
Last week, we saw a beautiful gap up to the upper HV63 implied ranges were profit was taken and accelerated selling begin. Our bi-weekly trending values have increased due to the increasing volatility. The weekly candle ended with some body to it, but was mostly flat due to the gap closing with a big wick up.
Our IV (85.47%) entering the week is trending within 4% of the sliding yearly lows and seemingly increasing as it tracks near-term trending markets -- HV10 (70.04%) has increased from the movement last week +7.35% and is now +22.17% off sliding yearly lows. As the spring is uncoiling, and bi-weekly regresses towards quarterly means our premium capture erodes and our range expands. I love trading volatility and ranges.
The 'strength of IV' here for HV10 is 82% -- so you have to account when positioning that the trending near-term volatility IS INCREASING but IS WEAKER than what is predicted. The 'strength of IV' here for HV63 is 101% -- showing that what is predicted is fairly valued to me on a regression scale.
Please -- Pull my chart onto your layout and use my implied ranges and data, follow along through the week on your own screen as we track and measure the volatility -- let's get this conversation started!
CHEERS
Trade closed: stop reached
I sold my longs this morning and rode my hedge down to where I covered. I have a sold call still in the water that will execute this Friday, unless PA really drills there's no need to cover.ABCs and STAY HEDGE'd
Dive deeper into the world of volatility with me — Post a comment, ask a question, and BOOST the post if you’d like.
Make sure you 'Grab my Chart' weekly to pull my data onto your screen!
Find me over on the 'X' platform:
@askHVtobidIV
Make sure you 'Grab my Chart' weekly to pull my data onto your screen!
Find me over on the 'X' platform:
@askHVtobidIV
Related publications
Disclaimer
The information and publications are not meant to be, and do not constitute, financial, investment, trading, or other types of advice or recommendations supplied or endorsed by TradingView. Read more in the Terms of Use.