The 'Fibonacci Triangle' and Historical Volatility
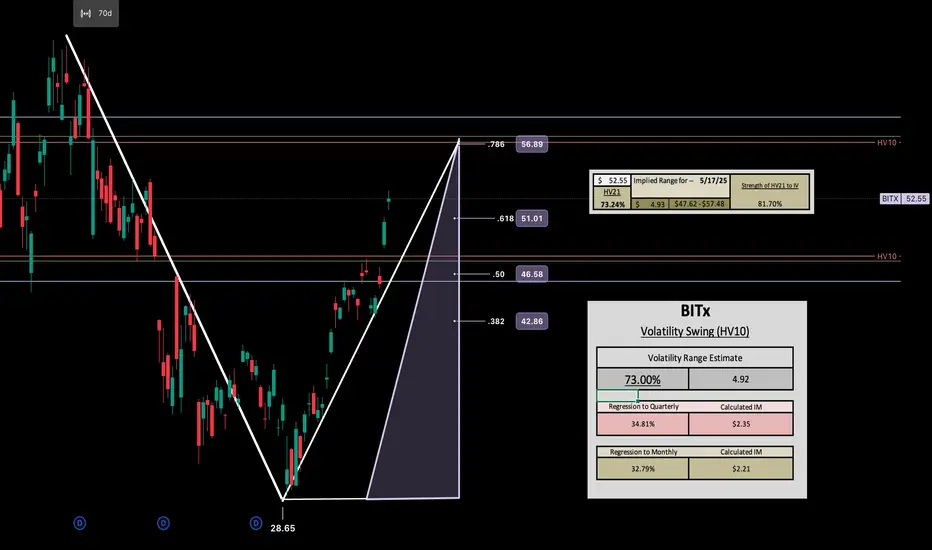
Along with the harmonic I just posted to the community showing confluence with HV63 regression that started to take place last week, I wanted to include my 'Fibonacci Triangle' with my predictive volatility range idea.
I see HV10 (bi-weekly) resonating off HV21 (monthly) to enter the week. This would create roughly a $4.92 range if correct for tomorrow. From there we can continue to increase in volatility into the week until full means regression to quarterly trending averages are met.
This can be reflected in the daily candle through the trending bi-weekly daily volatility print on the day, then calculated into range. Of course as always, my ranges are weighted to the current IV environment.
If my target range of monthly volatility is reached tomorrow, which holds confluence in the 78.60% retracement value from selling off with BTC for 70 days..i'd say there is probability to move another $2.21 in regression, putting us just below $60.00.
 BITX
BITX
I see HV10 (bi-weekly) resonating off HV21 (monthly) to enter the week. This would create roughly a $4.92 range if correct for tomorrow. From there we can continue to increase in volatility into the week until full means regression to quarterly trending averages are met.
This can be reflected in the daily candle through the trending bi-weekly daily volatility print on the day, then calculated into range. Of course as always, my ranges are weighted to the current IV environment.
If my target range of monthly volatility is reached tomorrow, which holds confluence in the 78.60% retracement value from selling off with BTC for 70 days..i'd say there is probability to move another $2.21 in regression, putting us just below $60.00.
Trade closed: target reached
Congratulations to all following or playing along — today we reached the target of the Fibonacci Triangle 78.6% retracement ahead of schedule. If you are following my harmonic post I will be updating next that I am still in position there. CHEERS!Dive deeper into the world of volatility with me — Post a comment, ask a question, and BOOST the post if you’d like.
Make sure you 'Grab my Chart' weekly to pull my data onto your screen!
Find me over on the 'X' platform:
@askHVtobidIV
Make sure you 'Grab my Chart' weekly to pull my data onto your screen!
Find me over on the 'X' platform:
@askHVtobidIV
Disclaimer
The information and publications are not meant to be, and do not constitute, financial, investment, trading, or other types of advice or recommendations supplied or endorsed by TradingView. Read more in the Terms of Use.
Dive deeper into the world of volatility with me — Post a comment, ask a question, and BOOST the post if you’d like.
Make sure you 'Grab my Chart' weekly to pull my data onto your screen!
Find me over on the 'X' platform:
@askHVtobidIV
Make sure you 'Grab my Chart' weekly to pull my data onto your screen!
Find me over on the 'X' platform:
@askHVtobidIV
Disclaimer
The information and publications are not meant to be, and do not constitute, financial, investment, trading, or other types of advice or recommendations supplied or endorsed by TradingView. Read more in the Terms of Use.