BITX — Harmonic Completion: Expression in Time for point ‘D’
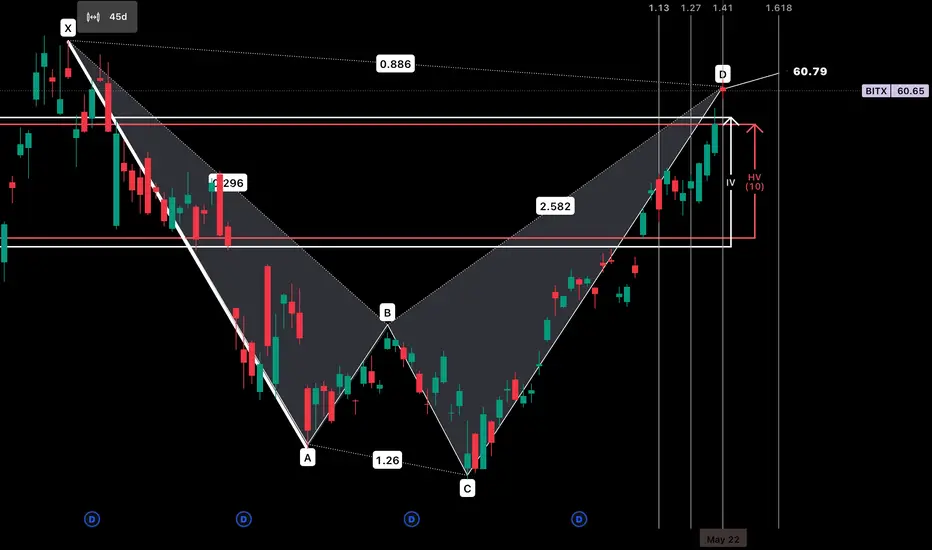
I wanted to share my concept of fibonacci retracement in time with the community and why I selected the 86.6% retracement of this sell off for point ‘D’ within my harmonic structure with an exit and completion of today.
This was a 45 day sell off after the first ‘W’ price distribution from the top. I always decide on a pivot candle to start my retracement off the impulse rally. Doesn’t matter if it is bullish or bearish by nature. When point ‘B’ was created it extended past the 23.6% value but fell short of 50% where it continued to sell down below the original impulse rally. When
Next I run the ‘A-B-C Trend-Based Time’ tool and input my extensions. You will find when I build my ‘Fibonacci Triangle’ I run .382-.786 symmetrically in price/time, but for my harmonics I use extension in time to locate my point ‘D’ and pair that with my retracement level. You can see in my chart above that there is daily significance more often than not on these days. I tend to run my X-A-B-C-D tool to the harmonic extension zones in time and track the trend. This example above, it was the 86.6% retracement of a 45 sell off that executed on the 141% value in time from that sell off.
Feel me?
If you like the conversation, drop a boost and give a follow! Let’s talked price and time fibonacci symmetry. I always get down on historical volatility as well with my weighted system to ever sliding IV — Come find me, let’s go!
Dive deeper into the world of volatility with me — Post a comment, ask a question, and BOOST the post if you’d like.
Make sure you 'Grab my Chart' weekly to pull my data onto your screen!
Find me over on the 'X' platform:
@askHVtobidIV
Make sure you 'Grab my Chart' weekly to pull my data onto your screen!
Find me over on the 'X' platform:
@askHVtobidIV
Disclaimer
The information and publications are not meant to be, and do not constitute, financial, investment, trading, or other types of advice or recommendations supplied or endorsed by TradingView. Read more in the Terms of Use.