Analyzing and trading stocks using Dr. Elder's Three Screen Meth
The first thing I do is analyze the weekly chart. Here I want to see price divergence to the MACD indicator

Next, I go to the daily chart and want to see the divergence between the price and the indicator

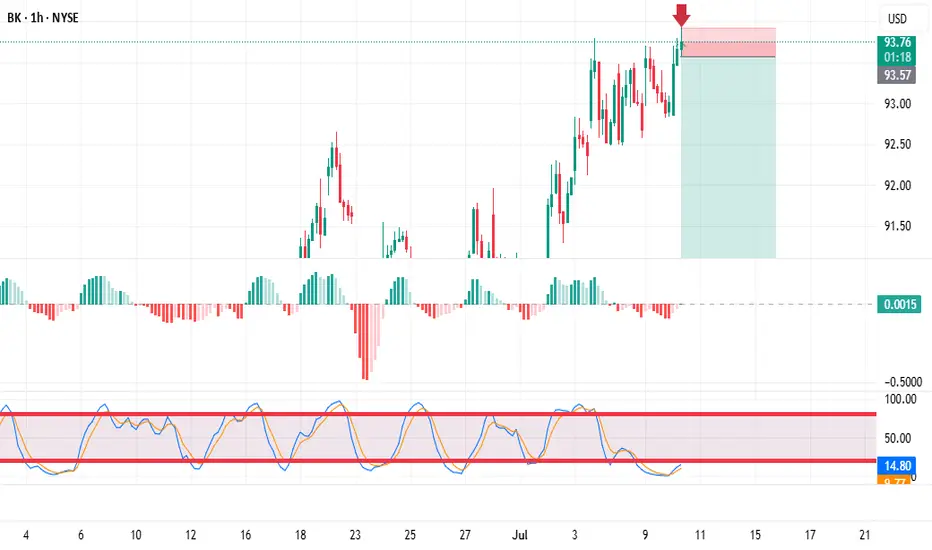
I then move to the hourly chart and look for the divergence here.

The price has only risen a couple of points above the previous peak, but that's enough for me. I enter a trade when the bar is broken
 BK
BK
Next, I go to the daily chart and want to see the divergence between the price and the indicator
I then move to the hourly chart and look for the divergence here.
The price has only risen a couple of points above the previous peak, but that's enough for me. I enter a trade when the bar is broken
Trade active
the price activated my pending sell orderTrade closed: stop reached
The price has reached the stop loss. Indicators show the weakness of the bulls. I'm waiting for the right moment to go short.Note
The analysis is current, enter the trade when the candlestick marked with an arrow breaks through
Disclaimer
The information and publications are not meant to be, and do not constitute, financial, investment, trading, or other types of advice or recommendations supplied or endorsed by TradingView. Read more in the Terms of Use.
Disclaimer
The information and publications are not meant to be, and do not constitute, financial, investment, trading, or other types of advice or recommendations supplied or endorsed by TradingView. Read more in the Terms of Use.