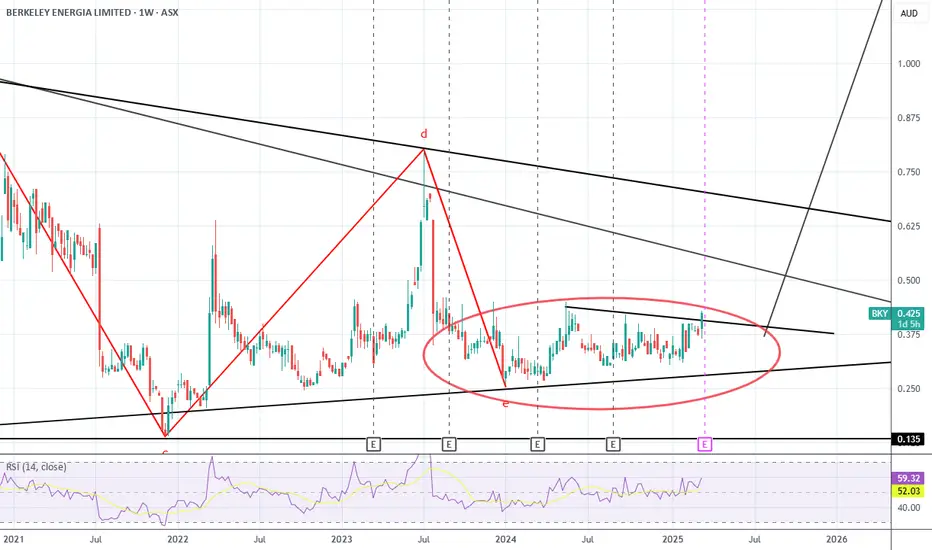
Weekly chart of BKY
Currently breaking out of weekly triangle within a larger triangle pattern
Will likely get to $0.57c relatively quickly which is the larger triangle trend line
Given the hovering around current levels I'm almost thinking that is accumulation which may push this through multi year resistances and breakout for a strong move higher
Full disclosure this is a long term position I have had for a while now...
Trade active
Hope others got onboard...!Disclaimer
The information and publications are not meant to be, and do not constitute, financial, investment, trading, or other types of advice or recommendations supplied or endorsed by TradingView. Read more in the Terms of Use.
Disclaimer
The information and publications are not meant to be, and do not constitute, financial, investment, trading, or other types of advice or recommendations supplied or endorsed by TradingView. Read more in the Terms of Use.