BlackRock Inc. (NYSE:  BLK) reported adjusted earnings per share (EPS) of $11.30 for Q1 2025. This beat the Zacks Consensus Estimate of $10.25, marking a 10.24% surprise. In the same quarter last year, EPS was $9.81.
Revenue came in at $5.28 billion, missing the estimate of $5.33 billion by 1%. However, it rose from $4.73 billion a year earlier. The company has surpassed EPS estimates in all four of the last quarters and has topped consensus estimates twice in that span. In the previous quarter, BlackRock posted EPS of $11.93, beating the $11.27 estimate. That represented a surprise of 5.86%.
BlackRock operates in the Financial - Investment Management industry. The market now awaits management’s outlook for future earnings. This will shape short-term price direction. So far in 2025, BlackRock shares have dropped 16.2%. In comparison, the S&P 500 has declined 10.4%.
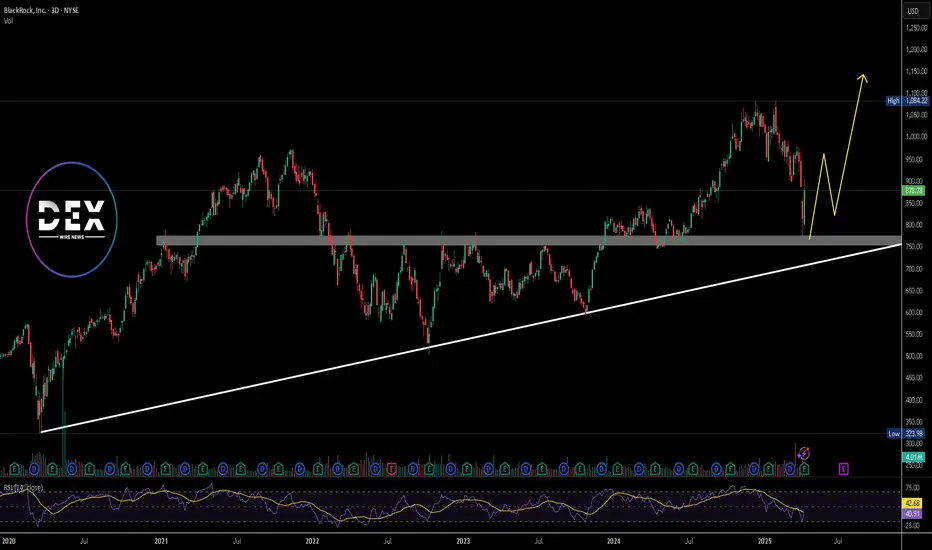
Technical Analysis
BlackRock rebounded from a strong support zone near $780. This level aligns with the long-term horizontal support level that has held for over 3 years now. The RSI sits at 41, indicating it is nearly oversold. However, a bullish reversal momentum is forming around the support zone.
If the price continues to rise, resistance and target lie at the $1,084.22 recent high. A break above $950 may trigger a run toward the $1,000–$1,084 range. If the price is rejected, it could revisit the $780 support or possibly the ascending trendline sitting below the horizontal support.
Revenue came in at $5.28 billion, missing the estimate of $5.33 billion by 1%. However, it rose from $4.73 billion a year earlier. The company has surpassed EPS estimates in all four of the last quarters and has topped consensus estimates twice in that span. In the previous quarter, BlackRock posted EPS of $11.93, beating the $11.27 estimate. That represented a surprise of 5.86%.
BlackRock operates in the Financial - Investment Management industry. The market now awaits management’s outlook for future earnings. This will shape short-term price direction. So far in 2025, BlackRock shares have dropped 16.2%. In comparison, the S&P 500 has declined 10.4%.
Technical Analysis
BlackRock rebounded from a strong support zone near $780. This level aligns with the long-term horizontal support level that has held for over 3 years now. The RSI sits at 41, indicating it is nearly oversold. However, a bullish reversal momentum is forming around the support zone.
If the price continues to rise, resistance and target lie at the $1,084.22 recent high. A break above $950 may trigger a run toward the $1,000–$1,084 range. If the price is rejected, it could revisit the $780 support or possibly the ascending trendline sitting below the horizontal support.
⭐⭐⭐ Sign Up for Free ⭐⭐⭐
1) Download our Mobile App >> link-to.app/dexwirenews
2) Join our Telegram >> t.me/DEXWireNews
3) Sign Up for Text Alerts >>
dexwirenews.com/TEXT
4) Follow @DEXWireNews on Social Media
1) Download our Mobile App >> link-to.app/dexwirenews
2) Join our Telegram >> t.me/DEXWireNews
3) Sign Up for Text Alerts >>
dexwirenews.com/TEXT
4) Follow @DEXWireNews on Social Media
Related publications
Disclaimer
The information and publications are not meant to be, and do not constitute, financial, investment, trading, or other types of advice or recommendations supplied or endorsed by TradingView. Read more in the Terms of Use.