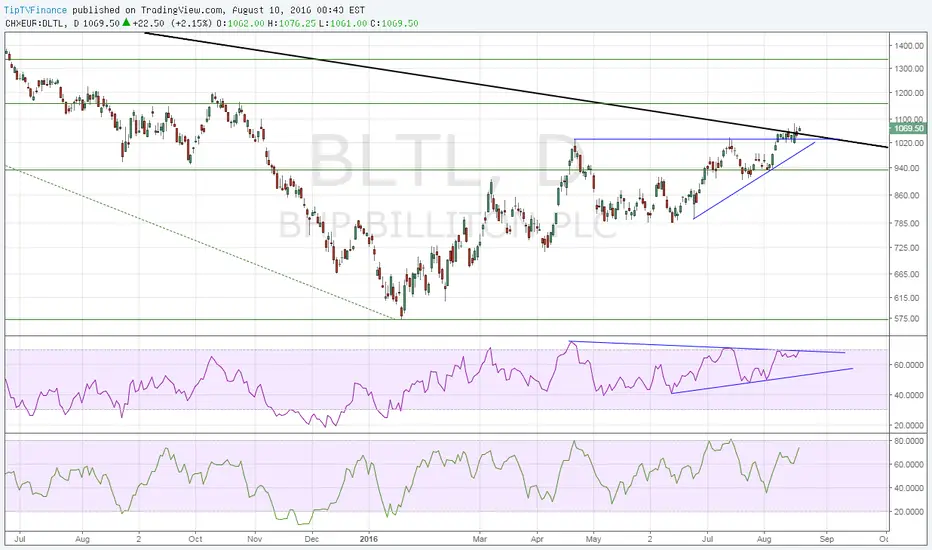
BHP Billiton – LT falling trend line breached

Daily chart pattern – Two year long falling trend line has been breached
RSI eyeing bullish break
Money flow index suggesting further gains
Prices thus appear on track to test next major hurdle seen directly at 1156.27 levels (38.2% Fibo of 2014 high – 2016 low).
Bullish invalidation is see only if prices see a day end close below 1030.50.
RSI eyeing bullish break
Money flow index suggesting further gains
Prices thus appear on track to test next major hurdle seen directly at 1156.27 levels (38.2% Fibo of 2014 high – 2016 low).
Bullish invalidation is see only if prices see a day end close below 1030.50.
Related publications
Disclaimer
The information and publications are not meant to be, and do not constitute, financial, investment, trading, or other types of advice or recommendations supplied or endorsed by TradingView. Read more in the Terms of Use.
Related publications
Disclaimer
The information and publications are not meant to be, and do not constitute, financial, investment, trading, or other types of advice or recommendations supplied or endorsed by TradingView. Read more in the Terms of Use.