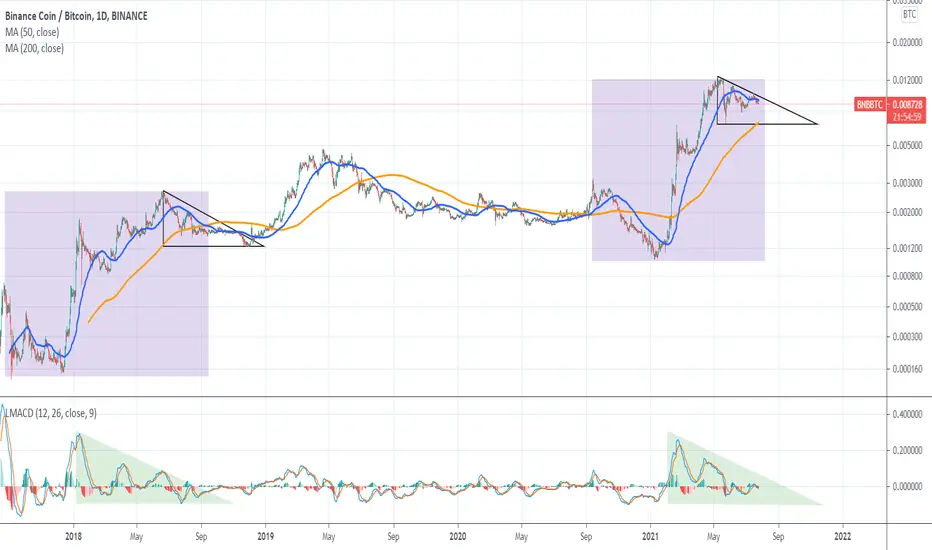
This chart points out the obvious similarities of BNBBTC between the 2021 price action and that of 2018. As you see since September 2020 the pair has been following closely the pattern of mid 2017 - 2018. Even the LMACD sequences are identical.
If that continues to be the case, then what this pattern suggests for the pair now, is that a consolidation within a Triangle may be possible for another 2-3 months before one last rally.
Do you think that will play out?
Previous BNBBTC idea:
** Please support this idea with your likes and comments, it is the best way to keep it relevant and support me. **
--------------------------------------------------------------------------------------------------------
!! Donations via TradingView coins also help me a great deal at posting more free trading content and signals here !!
🎉 👍 Shout-out to TradingShot's 💰 top TradingView Coin donor 💰 this week ==> CryptoCreatin
--------------------------------------------------------------------------------------------------------
👑Best Signals (Forex/Crypto+70% accuracy) & Account Management (+20% profit/month on 10k accounts)
💰Free Channel t.me/tradingshotglobal
🤵Contact info@tradingshot.com t.me/tradingshot
🔥New service: next X100 crypto GEMS!
💰Free Channel t.me/tradingshotglobal
🤵Contact info@tradingshot.com t.me/tradingshot
🔥New service: next X100 crypto GEMS!
Disclaimer
The information and publications are not meant to be, and do not constitute, financial, investment, trading, or other types of advice or recommendations supplied or endorsed by TradingView. Read more in the Terms of Use.