🔍 1. Chart structure
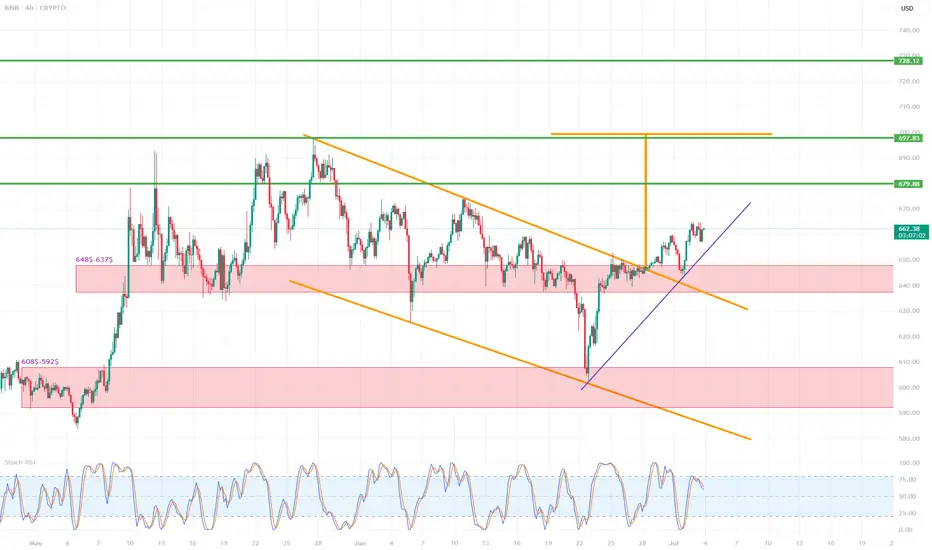
Instrument: Binance Coin / USD (BNB/USD)
Interval: 4 hours
📐 2. Technical formations
🔸 Breakout from the descending wedge formation
The descending wedge (orange lines) is a bullish formation - it suggests a potential breakout upwards.
The breakout occurred dynamically, with a large breakout candle (confirmation of the formation).
The goal of breaking out of the wedge is usually the height of the entire formation - this is marked with an orange arrow.
📈 Breakout range (target): around $697–710
🟢 Potential next targets:
697.83 (local resistance/projection result)
710.73 (main wedge height projection)
728.12 (strong resistance from history)
📊 3. Supports and resistances
🟥 Support zones (red rectangles):
$648.5–637.5 – previous resistance, now tested as support after the breakout.
$608.5–592.5 – strong support from previous lows.
🔼 Currently, the price has tested the upper support zone (648–637), reacted positively and continues to move up.
🟩 Resistance levels (green horizontal lines):
679.88 USD – local resistance, first target after breaking out of the wedge.
697.83 USD – projected range from the formation.
710.73 USD – full technical range of the breakout.
728.12 USD – strong resistance from history, may be a long-term target.
📉 4. Trends and support lines
Purple upward trend line – currently the price is above, which confirms the short-term upward trend.
Its break may lead to a retest of 648–637 USD.
Only below this zone can a larger correction be considered.
📈 5. Stochastic RSI indicator
Currently in the overbought zone (above 80).
Possible temporary cooling – signal for local correction / consolidation.
It is worth waiting for the indicator to go down to around 20 to re-enter the long.
✅ 6. Scenarios
🔼 Bullish (base) scenario:
Staying above 648–637 USD.
Maintaining the uptrend line.
Continuation to 679.88 → 697.83 → 710.73.
🔽 Bearish scenario:
Breaking the purple trend line.
Returning below 648 USD → going down to the 608–592 zone.
Negation of the breakout from the wedge.
📌 Final conclusions
Breaking out from the descending wedge is a strong pro-growth signal.
The price behaves in accordance with technical analysis, testing the previous resistance as support.
Currently, the retest and consolidation phase is underway – maintaining the trend line and the level of $648 will be key.
The medium-term target is $697–710.
Disclaimer
The information and publications are not meant to be, and do not constitute, financial, investment, trading, or other types of advice or recommendations supplied or endorsed by TradingView. Read more in the Terms of Use.
Disclaimer
The information and publications are not meant to be, and do not constitute, financial, investment, trading, or other types of advice or recommendations supplied or endorsed by TradingView. Read more in the Terms of Use.