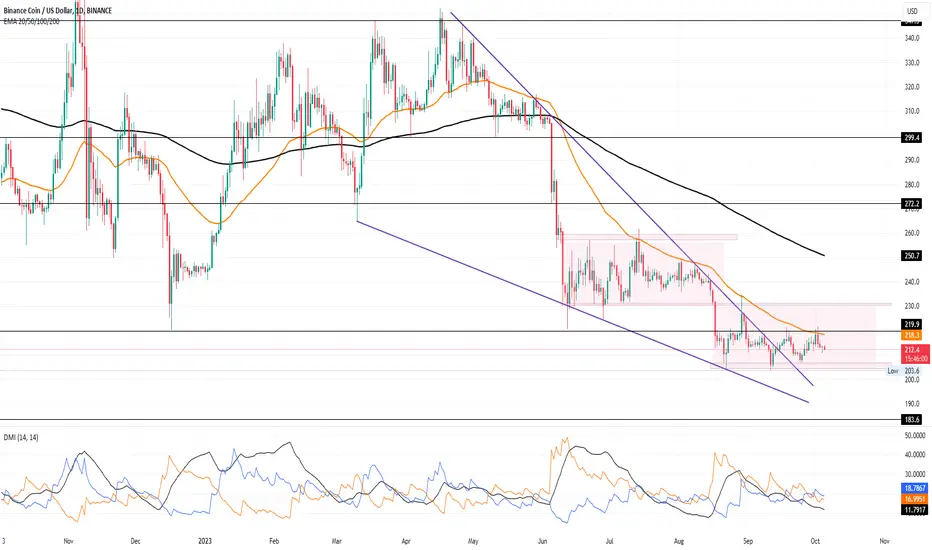
Falling Wedge: BNB shows a falling wedge breakout in the daily chart.
Resistance Zone: Sellers are dominating the $219-$220 mark.
Potential for $250: A breakout above $220 could lead BNB to $250.
Recent Decline: BNB has fallen 41% between April and September 2023.
50-Day EMA: The declining 50-day EMA is supporting the bearish trend.
Double Top: A potential double top pattern is forming at $219.
Current Price: BNB is trading at $212 with an intraday fall of 0.56%.
Bearish Neckline: A bearish pattern could complete with a neckline at $206-205.
Psychological Mark: $200 is a crucial psychological level.
Technical Indicators: The ADX line is falling sharply, indicating loss of momentum.
Bearish Crossover: DI lines are showing a potential bearish crossover.
Flip Side: A downtrend could take BNB to new lows, with key supports at $180 and $150.
Disclaimer
The information and publications are not meant to be, and do not constitute, financial, investment, trading, or other types of advice or recommendations supplied or endorsed by TradingView. Read more in the Terms of Use.
Disclaimer
The information and publications are not meant to be, and do not constitute, financial, investment, trading, or other types of advice or recommendations supplied or endorsed by TradingView. Read more in the Terms of Use.