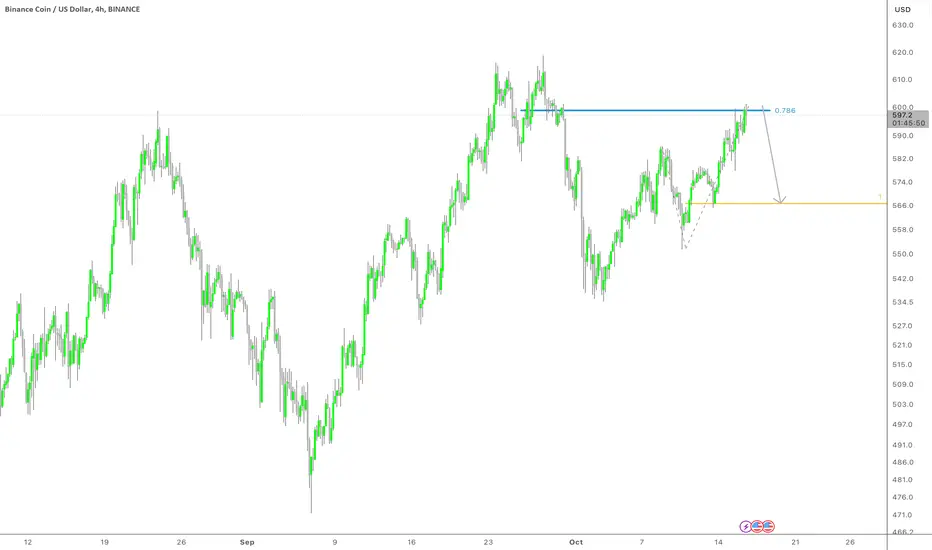
It seems that in this chart, you are expecting a price drop, especially after reaching the resistance level marked at the 0.786 Fibonacci retracement around $600. Additionally, you are predicting that after this decline, the price may fall to the support level near $566 (the orange line).
It looks like the overall trend is still bullish, but a temporary correction in the price is likely. If the support level holds, another upward movement may occur.
This analysis is based on Fibonacci levels and classic patterns, and if other indicators or data are available, they can also be considered.
Trade closed: target reached
OKDisclaimer
The information and publications are not meant to be, and do not constitute, financial, investment, trading, or other types of advice or recommendations supplied or endorsed by TradingView. Read more in the Terms of Use.
Disclaimer
The information and publications are not meant to be, and do not constitute, financial, investment, trading, or other types of advice or recommendations supplied or endorsed by TradingView. Read more in the Terms of Use.