There are a lot of technical analysis methods to use, my favorite method is to combine several technical analysis and look for the same point as strong support to buy and strong resistance to take profit.
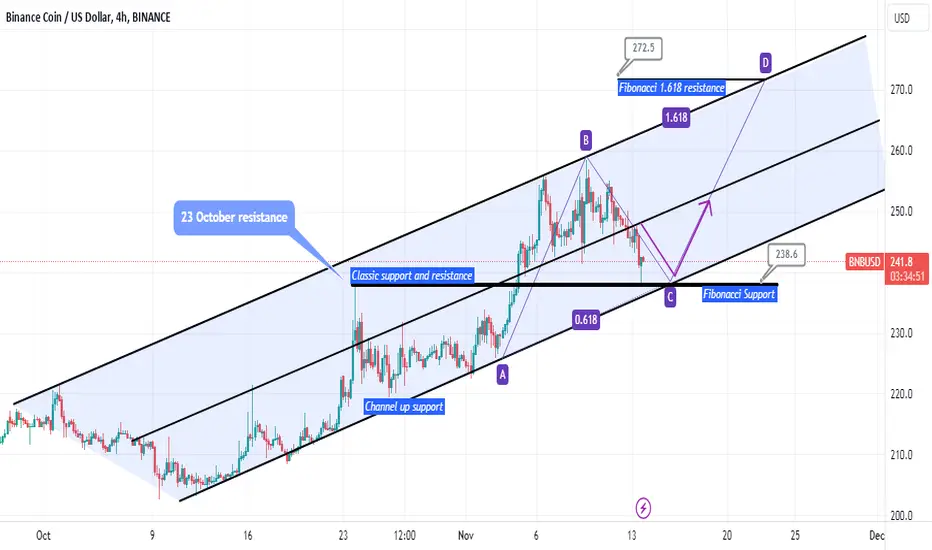
In this example, I use chart pattern, fibonacci ABCD pattern and classic support and resistance.
Chart pattern
channel up with medium line perform strongly, yesterday this medium line broke down and tried to reach channel up support.
channel up support can be a good entry point with target at medium line or maximum target at channel up resistance
Classic support and resistance
Resistance become support or support become resistance also a strong technical analysis method.
in this chart, we have 23 October resistance at $238.6, and now it has become new support.
ABCD Fibonacci Pattern
Fibonacci are the best pattern to combine with channel up, especially if we have symmetrical channel up.
In many cases, 0.618 touch channel up support and 1.618 touch channel up resistance as bullish target.
I am a naked trade analyst, so in every analysis I do not use technical indicators, but sometimes people used to combine technical indicator, ie. moving average, EMA, MacD, Bollinger band, and many others. As long as it is accurate and profitable, use it.
Let me know in comment below what kind of combination you like most.
Note
Nice proggress here,.strong bullish candle at 1 hour timeframe try to reach channel down resistance.
if this resistance cannot break, I will wait at fibonacci support $238.7 to enter another new long position
Note
channel down broken.. target at medium line almost reachNote
intraday mission accomplished, medium target reach,.Trade active
another success plan to buy at $238.7,awaiting for target around new resistance at $252.4
Trade closed: target reached
opened $238.7 closed $252.4mission complete
I will update this analysis if I found a new pattern
Note
nice pump at BNB, target almost reach with a single candle onlyTrade closed: target reached
this analysis close, target reachDisclaimer
The information and publications are not meant to be, and do not constitute, financial, investment, trading, or other types of advice or recommendations supplied or endorsed by TradingView. Read more in the Terms of Use.
Disclaimer
The information and publications are not meant to be, and do not constitute, financial, investment, trading, or other types of advice or recommendations supplied or endorsed by TradingView. Read more in the Terms of Use.