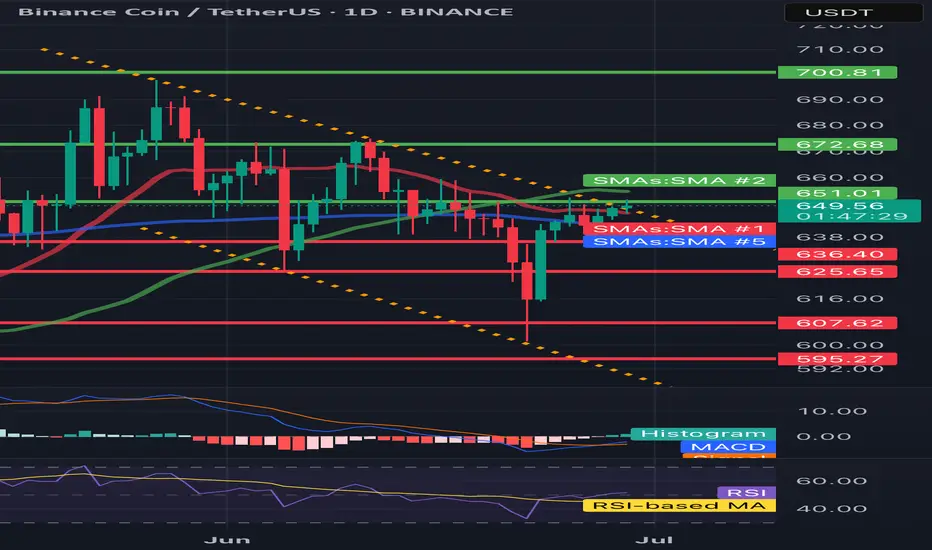
🕵️♂️ General context
• Steam: BNB/USDT
• Price: 649.52 USDT
• Time: 1D (daily interval)
• Currently, the reflection is underway after the inheritance, but the technical situation remains uncertain.
⸻
📈 Trend and market structure
• You can see a previous strong drop (visible long red candles).
• Currently, reflection is underway to the level of technical resistance (approx. 650–672 USDT).
• A medium -term inheritance trend is still in force - marked with an orange interrupted line of decreasing (inheritance) trend.
⸻
📊 Technical levels
🔹 Opora (green levels):
1. 651.01 USDT - the first tested resistance (current price right next to it).
2. 672.68 USDT - another resistance, above SMA (2), historically strong level of sales.
3. 700.81 USDT - strong psychological and technical level, tested in the past.
🔻 Support (red levels):
1. 636.40 USDT - short -term support (price maintaining just above this level).
2. 625.65 USDT - key support - if it is broken, a possible test of lower levels.
3. 607.62 and 595.27 USDT - subsequent support, where purchases appeared earlier (Long Knoty).
⸻
📉 Technical indicators
🔵 MacD
• Histogram comes out of red - a potential signal of Momentum change to upward.
• The MacD line begins to turn up to the signal line - possible Bullly Crossover soon (buy signal).
🟣 RSI
• RSI oscillates around line 40-50-it is a neutral zone with a slight tilt down, but RSI-Based has a possible reflection.
• Lack of purchase or sale - suggests that traffic can go both ways.
⸻
🔃 Medium walking (SMAS)
• The price is tested by several medium (green, red, blue line):
• SMA (1) and SMA (5) are similar and flat - no clear short -term trend.
• SMA (2) acts as a strong resistance at 672 USDT.
• Need to break out over 672.68 to recognize that the trend can turn around.
⸻
✅ Applications - technical scenarios
🔼 Bullish (upward) scenario:
• Crossing the level 651–672 USDT and closing the daily candle above.
• Confirmation by RSI> 50 and MacD crossover.
• Target: 700–710 USDT.
🔽 Bearish (inheritance) scenario:
• Price rejection with current resistance and descent below 636 → 625 USDT.
• If 625 falls, a possible drop in around 607/595 USDT.
• RSI may then fall into the sale zone.
⸻
🧠 Neutral / swing strategy
• Currently, the market in potential consolidation between 625 and 672 USDT.
• You can consider:
• Buying at the lower consolidation limit (625–636) with a stop-loss below 620.
• Short or Take Profit at the upper limit (670+) until it breaks out.
Disclaimer
The information and publications are not meant to be, and do not constitute, financial, investment, trading, or other types of advice or recommendations supplied or endorsed by TradingView. Read more in the Terms of Use.
Disclaimer
The information and publications are not meant to be, and do not constitute, financial, investment, trading, or other types of advice or recommendations supplied or endorsed by TradingView. Read more in the Terms of Use.