hello?
Welcome, traders.
If you "follow", you can always get new information quickly.
Please also click "Like".
Have a good day.
-------------------------------------
(BNBUSDT 1W Chart)

The key is whether it can be supported by rising to the 331.7-353.2 section.
To do that, you need to make sure you keep the price above 100EMA.
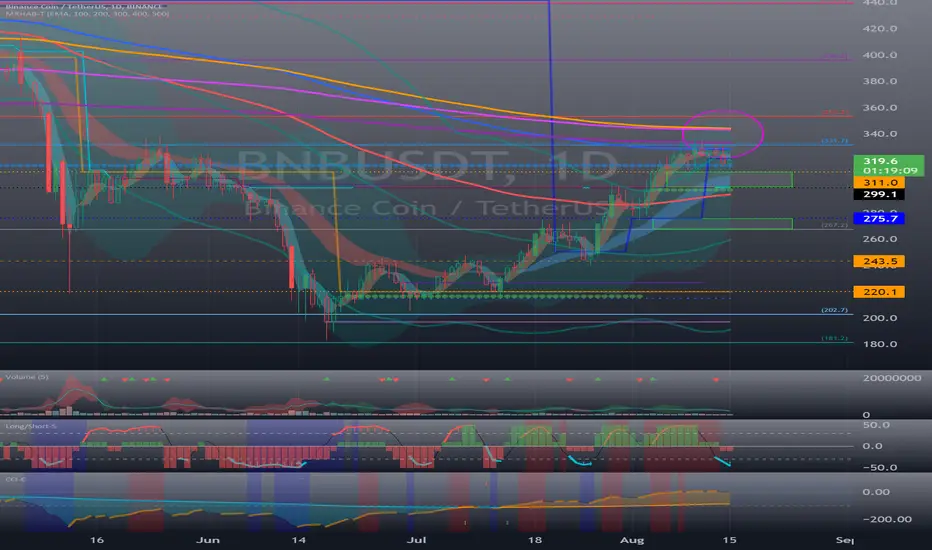
(1D chart)
Resistance: 331.7-353.2
1st support: 299.1-311.0
2nd support: 267.2-275.7
The 200-500 EMA line is concentrated near section 331.7-353.2.
Therefore, if it rises above the 331.7-353.2 section, it is expected to surge.
If not, you should check to see if it is supported in the 299.1-311.0 section.
------------------------------------------------------------ -------------------------------------------
** All descriptions are for reference only and do not guarantee a profit or loss in investment.
** The MRHAB-T indicator, which is inactive on the chart, contains indicators that indicate support and resistance points.
** Background color of Long/Short-S indicator: RSI oversold and overbought sections
** Background color of CCI-C indicator: When the short-term CCI line is below -100 and above +100, oversold and overbought sections are displayed.
** The OBV indicator was re-created by applying a formula to the DepthHouse Trading indicator, an indicator disclosed by oh92. (Thanks for this.)
(Short-term Stop Loss can be said to be a point where profit and loss can be preserved or additional entry can be made through split trading. It is a short-term investment perspective.)
---------------------------------
Welcome, traders.
If you "follow", you can always get new information quickly.
Please also click "Like".
Have a good day.
-------------------------------------
(BNBUSDT 1W Chart)
The key is whether it can be supported by rising to the 331.7-353.2 section.
To do that, you need to make sure you keep the price above 100EMA.
(1D chart)
Resistance: 331.7-353.2
1st support: 299.1-311.0
2nd support: 267.2-275.7
The 200-500 EMA line is concentrated near section 331.7-353.2.
Therefore, if it rises above the 331.7-353.2 section, it is expected to surge.
If not, you should check to see if it is supported in the 299.1-311.0 section.
------------------------------------------------------------ -------------------------------------------
** All descriptions are for reference only and do not guarantee a profit or loss in investment.
** The MRHAB-T indicator, which is inactive on the chart, contains indicators that indicate support and resistance points.
** Background color of Long/Short-S indicator: RSI oversold and overbought sections
** Background color of CCI-C indicator: When the short-term CCI line is below -100 and above +100, oversold and overbought sections are displayed.
** The OBV indicator was re-created by applying a formula to the DepthHouse Trading indicator, an indicator disclosed by oh92. (Thanks for this.)
(Short-term Stop Loss can be said to be a point where profit and loss can be preserved or additional entry can be made through split trading. It is a short-term investment perspective.)
---------------------------------
Note
The site "TradingGive.Com" is posting indiscriminate advertisements.You should be careful when viewing and using these comments.
Other content (coins, stocks, etc.) is frequently posted on X.
X에 다른 내용(코인, 주식 등)이 자주 게시.
◆ t.me/readCryptoChannel
[HA-MS Indicator]
bit.ly/3YxHgvN
[OBV Indicator]
bit.ly/4dcyny3
X에 다른 내용(코인, 주식 등)이 자주 게시.
◆ t.me/readCryptoChannel
[HA-MS Indicator]
bit.ly/3YxHgvN
[OBV Indicator]
bit.ly/4dcyny3
Related publications
Disclaimer
The information and publications are not meant to be, and do not constitute, financial, investment, trading, or other types of advice or recommendations supplied or endorsed by TradingView. Read more in the Terms of Use.