Binance (BNB) technical analysis:
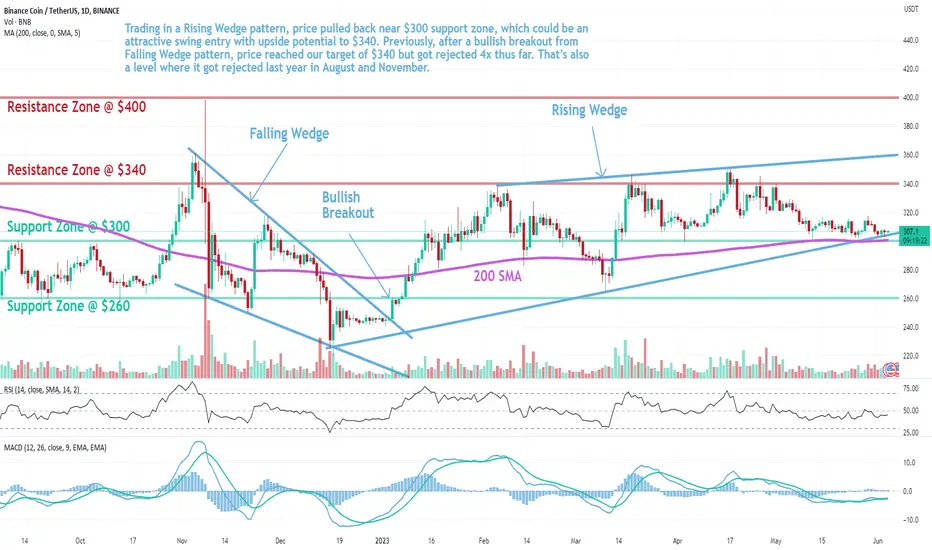
Trade setup: Trading in a Rising Wedge pattern, price pulled back near $300 support zone, which could be an attractive swing entry with upside potential to $340. Previously, after a bullish breakout from Falling Wedge pattern, price reached our target of $340 but got rejected 4x thus far. That’s also a level where it got rejected last year in August and November.
Patterns: Rising Wedge It usually forms after an uptrend and suggests a potential bearish reversal in the original uptrend. When price breaks the lower trend line the price is expected to trend lower. Emerging patterns (before a breakout occurs) can be traded by swing traders between the convergence lines; however, most traders should wait for a completed pattern with a breakout.
Trend: Downtrend on Short- and Medium-Term basis and Uptrend on Long-Term basis.
Momentum is Mixed as MACD Line is above MACD Signal Line (Bullish) but RSI < 45 (Bearish). MACD Histogram bars are declining, which suggests that momentum is weakening.
Support and Resistance: Nearest Support Zone is $300 (previous resistance), then $260. The nearest Resistance Zone is $340, then $400.
Disclaimer
The information and publications are not meant to be, and do not constitute, financial, investment, trading, or other types of advice or recommendations supplied or endorsed by TradingView. Read more in the Terms of Use.
Disclaimer
The information and publications are not meant to be, and do not constitute, financial, investment, trading, or other types of advice or recommendations supplied or endorsed by TradingView. Read more in the Terms of Use.