Markets love to repeat themselves.
But just because something repeats, doesn’t mean it’s predictable — or useful.
Let’s break down the main types of market cycles that traders talk about, and more importantly, let’s call out their flaws. No sugarcoating.
🔹 1. Time Cycles
These are based on the idea that price behaves in a similar way over specific time intervals — whether it’s 90 days, 4 years, or a custom Fibonacci count.
They show up in seasonal patterns, halving cycles (like Bitcoin), or through tools like Gann, Hurst, or even basic cycle lines.
The problem?
– The exact timing is rarely clean. A 120-day cycle might play out in 87 days next time.
– Flat, choppy markets will destroy any cycle-based setup.
– Different timeframes show different "cycles," so good luck aligning them.
– Most cycle tools are complicated and impractical for real-time decision making.
🔹 2. Psychological Cycles
The famous emotional rollercoaster: Hope → Euphoria → Fear → Panic → Capitulation → Depression → Optimism.
Every bull and bear market goes through these in some form — in theory.
The problem?
– It’s almost entirely subjective. Everyone sees a different phase.
– You usually recognize the cycle only after it’s over.
– Emotions aren’t equal across all assets — BTC retail emotions ≠ S&P500 institutional sentiment.
– There’s no precise tool to measure this. You’re mixing vibes with candles.
🔹 3. Structural Cycles (e.g. Wyckoff)
This one’s more about price behavior itself — accumulation, markup, distribution, markdown. The idea is that markets rotate through these four structural phases again and again.
The problem?
– Identifying where you are in the structure is hard in real time.
– Markets don’t always follow the Wyckoff textbook. Sometimes they just... go.
– It relies heavily on volume — and that doesn’t always align.
– Traders love to force a structure where there isn’t one. Confirmation bias, anyone?
🔹 4. Macro Cycles
Classic economic boom and bust: Expansion → Peak → Recession → Trough.
These cycles move slow but shape everything — interest rates, employment, growth, and eventually, risk assets.
The problem?
– They’re way too slow to help short-term traders.
– Good luck timing the top or bottom of the economy.
– Governments and central banks constantly interfere with natural cycles.
– Most macro data is lagging, so you’re reacting to history, not forecasting the future.
🔹 5. Liquidity / Volume Cycles
This idea tracks capital flow: when liquidity comes in, prices rise. When it dries up, risk assets fall. Simple, right?
The problem?
– Volume isn’t universal. Crypto volume =/= stock volume =/= forex volume.
– You can’t always track capital flow accurately, especially in OTC markets.
– Low volume doesn’t always mean weakness — sometimes it’s just summer.
– Volume data can be misleading, especially on shady exchanges.
🔹 6. Fractal Cycles
Markets repeat — at every level. 5-minute looks like the 4-hour, which looks like the daily. Elliott wave, harmonic patterns, whatever — the idea is that patterns echo across timeframes.
The problem?
– Pattern recognition can be wildly subjective.
– The market doesn’t always care about geometry. Sometimes it’s just noise.
– By the time a pattern is “confirmed,” you missed the move.
– Focusing too much on pattern symmetry makes you blind to macro/fundamentals.
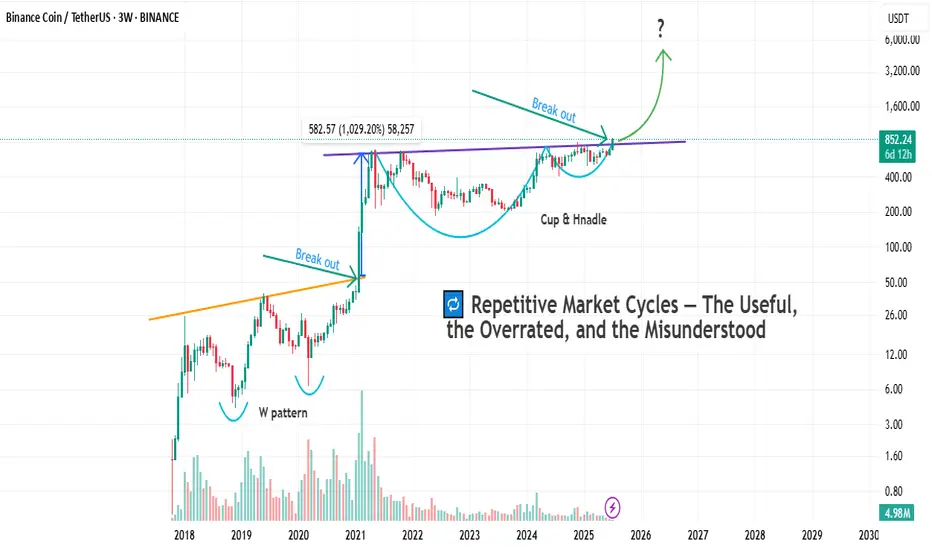
So after breaking all that down, let’s finally get to the chart in front of us.
Let’s take a closer look and see which cycle has actually played out here — and more importantly, which one actually helped :
As you can see on the chart, before every breakout above the previous all-time high, the market tends to form some sort of bottoming structure or reversal pattern.
And once that structure completes, the actual breakout usually leads to a solid price pump.
But here’s the key question:
Which one of the cycles we talked about earlier does this actually follow?
If you ask me, a professional trader will always try to use every tool available — not because any single one gives you the answer, but because combining them gets you closer to what's likely to happen.
And that’s what separates a well-rounded trader from a one-dimensional one.
Why do I say “one-dimensional”?
Because if you insist on looking at the market through a single lens, you’re bound to make bad decisions. We’re not here to prove our personal theories — we’re here to profit from what actually happens in the market, not what we think should happen.
In the chart above, we actually see a mix of all the cycles we talked about.
But I’d love to hear from you as well — let’s brainstorm together.
What do you see here as a trader?
And what’s your take on this setup?
Bottom Line
Yes, markets repeat.
But repetition doesn’t equal reliability.
Every cycle has its use — and its blind spot.
Know the difference. Use what fits your style.
And don’t romanticize a model just because it looks clean on a chart from six months ago.
But just because something repeats, doesn’t mean it’s predictable — or useful.
Let’s break down the main types of market cycles that traders talk about, and more importantly, let’s call out their flaws. No sugarcoating.
🔹 1. Time Cycles
These are based on the idea that price behaves in a similar way over specific time intervals — whether it’s 90 days, 4 years, or a custom Fibonacci count.
They show up in seasonal patterns, halving cycles (like Bitcoin), or through tools like Gann, Hurst, or even basic cycle lines.
The problem?
– The exact timing is rarely clean. A 120-day cycle might play out in 87 days next time.
– Flat, choppy markets will destroy any cycle-based setup.
– Different timeframes show different "cycles," so good luck aligning them.
– Most cycle tools are complicated and impractical for real-time decision making.
🔹 2. Psychological Cycles
The famous emotional rollercoaster: Hope → Euphoria → Fear → Panic → Capitulation → Depression → Optimism.
Every bull and bear market goes through these in some form — in theory.
The problem?
– It’s almost entirely subjective. Everyone sees a different phase.
– You usually recognize the cycle only after it’s over.
– Emotions aren’t equal across all assets — BTC retail emotions ≠ S&P500 institutional sentiment.
– There’s no precise tool to measure this. You’re mixing vibes with candles.
🔹 3. Structural Cycles (e.g. Wyckoff)
This one’s more about price behavior itself — accumulation, markup, distribution, markdown. The idea is that markets rotate through these four structural phases again and again.
The problem?
– Identifying where you are in the structure is hard in real time.
– Markets don’t always follow the Wyckoff textbook. Sometimes they just... go.
– It relies heavily on volume — and that doesn’t always align.
– Traders love to force a structure where there isn’t one. Confirmation bias, anyone?
🔹 4. Macro Cycles
Classic economic boom and bust: Expansion → Peak → Recession → Trough.
These cycles move slow but shape everything — interest rates, employment, growth, and eventually, risk assets.
The problem?
– They’re way too slow to help short-term traders.
– Good luck timing the top or bottom of the economy.
– Governments and central banks constantly interfere with natural cycles.
– Most macro data is lagging, so you’re reacting to history, not forecasting the future.
🔹 5. Liquidity / Volume Cycles
This idea tracks capital flow: when liquidity comes in, prices rise. When it dries up, risk assets fall. Simple, right?
The problem?
– Volume isn’t universal. Crypto volume =/= stock volume =/= forex volume.
– You can’t always track capital flow accurately, especially in OTC markets.
– Low volume doesn’t always mean weakness — sometimes it’s just summer.
– Volume data can be misleading, especially on shady exchanges.
🔹 6. Fractal Cycles
Markets repeat — at every level. 5-minute looks like the 4-hour, which looks like the daily. Elliott wave, harmonic patterns, whatever — the idea is that patterns echo across timeframes.
The problem?
– Pattern recognition can be wildly subjective.
– The market doesn’t always care about geometry. Sometimes it’s just noise.
– By the time a pattern is “confirmed,” you missed the move.
– Focusing too much on pattern symmetry makes you blind to macro/fundamentals.
So after breaking all that down, let’s finally get to the chart in front of us.
Let’s take a closer look and see which cycle has actually played out here — and more importantly, which one actually helped :
As you can see on the chart, before every breakout above the previous all-time high, the market tends to form some sort of bottoming structure or reversal pattern.
And once that structure completes, the actual breakout usually leads to a solid price pump.
But here’s the key question:
Which one of the cycles we talked about earlier does this actually follow?
If you ask me, a professional trader will always try to use every tool available — not because any single one gives you the answer, but because combining them gets you closer to what's likely to happen.
And that’s what separates a well-rounded trader from a one-dimensional one.
Why do I say “one-dimensional”?
Because if you insist on looking at the market through a single lens, you’re bound to make bad decisions. We’re not here to prove our personal theories — we’re here to profit from what actually happens in the market, not what we think should happen.
In the chart above, we actually see a mix of all the cycles we talked about.
But I’d love to hear from you as well — let’s brainstorm together.
What do you see here as a trader?
And what’s your take on this setup?
Bottom Line
Yes, markets repeat.
But repetition doesn’t equal reliability.
Every cycle has its use — and its blind spot.
Know the difference. Use what fits your style.
And don’t romanticize a model just because it looks clean on a chart from six months ago.
_____________________________________
🐺 Discipline is rarely enjoyable ,
But almost always profitable 🐺
TElEGRAM CHANNEL : t.me/KIU_COIN
_____________________________________
🐺 Discipline is rarely enjoyable ,
But almost always profitable 🐺
TElEGRAM CHANNEL : t.me/KIU_COIN
_____________________________________
Related publications
Disclaimer
The information and publications are not meant to be, and do not constitute, financial, investment, trading, or other types of advice or recommendations supplied or endorsed by TradingView. Read more in the Terms of Use.
_____________________________________
🐺 Discipline is rarely enjoyable ,
But almost always profitable 🐺
TElEGRAM CHANNEL : t.me/KIU_COIN
_____________________________________
🐺 Discipline is rarely enjoyable ,
But almost always profitable 🐺
TElEGRAM CHANNEL : t.me/KIU_COIN
_____________________________________
Related publications
Disclaimer
The information and publications are not meant to be, and do not constitute, financial, investment, trading, or other types of advice or recommendations supplied or endorsed by TradingView. Read more in the Terms of Use.