Binance (BNB) technical analysis:
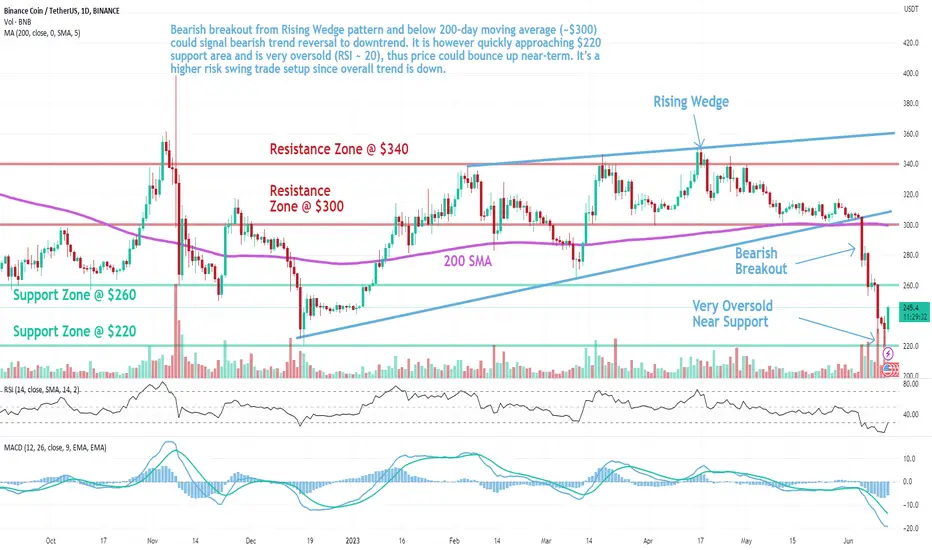
Trade setup: Bearish breakout from Rising Wedge pattern and below 200-day moving average (~$300) signaled bearish trend reversal to downtrend. It is however quickly approaching $220 support area and is very oversold (RSI ~ 20), thus price could bounce up near-term. It’s a higher risk swing trade setup since overall trend is down.
Patterns: Rising Wedge It usually forms after an uptrend and suggests a potential bearish reversal in the original uptrend. When price breaks the lower trend line the price is expected to trend lower. Emerging patterns (before a breakout occurs) can be traded by swing traders between the convergence lines; however, most traders should wait for a completed pattern with a breakout.
Trend: Downtrend across all time horizons (Short- Medium- and Long-Term).
Momentum is Bearish but extremely oversold. (MACD Line below MACD Signal Line). RSI is Bearish (< 45) but extremely oversold (< 20), which could imply that price could briefly stabilize or bounce if it reaches Support.
Support and Resistance:Nearest Support Zone is $220. The nearest Resistance Zone is $260 (previous support), then $300.
Disclaimer
The information and publications are not meant to be, and do not constitute, financial, investment, trading, or other types of advice or recommendations supplied or endorsed by TradingView. Read more in the Terms of Use.
Disclaimer
The information and publications are not meant to be, and do not constitute, financial, investment, trading, or other types of advice or recommendations supplied or endorsed by TradingView. Read more in the Terms of Use.