hi traders
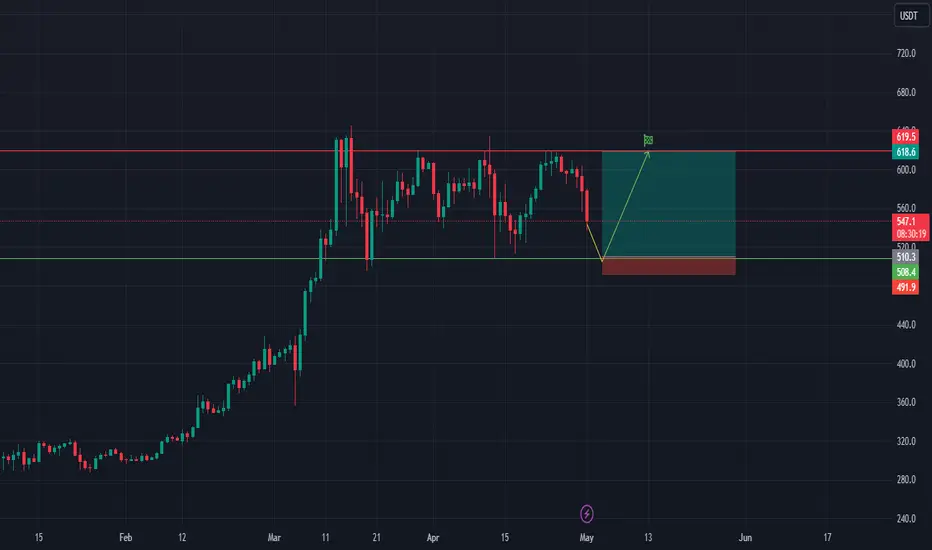
Let's take a look at BNBUSDT.
The chart is very self-explanatory.
Buy at the bottom of the range and sell at the top of the range.
Expecting the support to hold and give traders a chance to buy at the support again.
If support fails, it may go much lower, so don't forget to put a stop loss !
Good luck
💥 Free signals and ideas ➡ t.me/vfinvestment
Disclaimer
The information and publications are not meant to be, and do not constitute, financial, investment, trading, or other types of advice or recommendations supplied or endorsed by TradingView. Read more in the Terms of Use.
💥 Free signals and ideas ➡ t.me/vfinvestment
Disclaimer
The information and publications are not meant to be, and do not constitute, financial, investment, trading, or other types of advice or recommendations supplied or endorsed by TradingView. Read more in the Terms of Use.