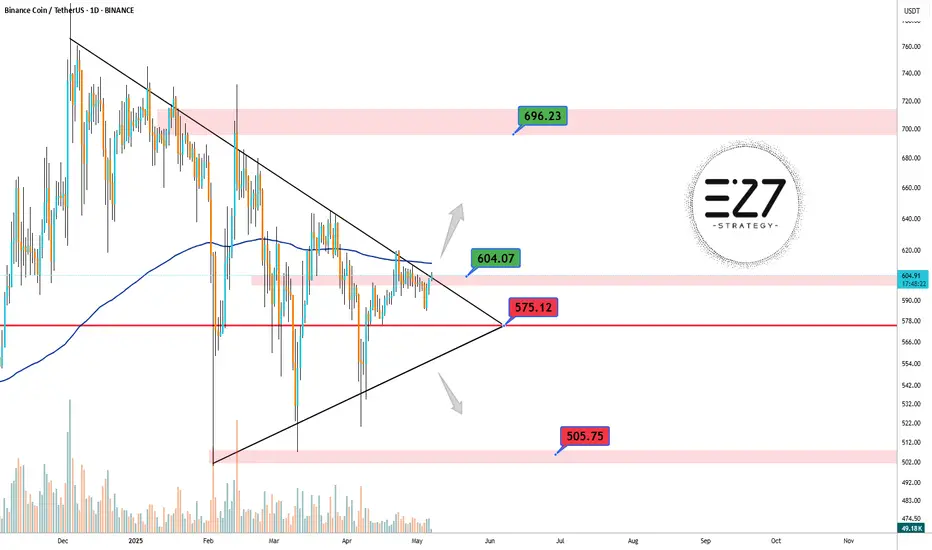
On the daily chart of BNB, a symmetrical triangle has formed, and the price is approaching a breakout point. The $600–$604 zone, aligned with the 200-day moving average and the descending trendline, acts as a key resistance. A bullish breakout could push the price toward the $696 area. On the downside, the $575 support is crucial — if broken, the next potential drop could target the $505 zone. Price compression and declining volatility suggest a strong move is likely soon.
📈 A major move is coming for BNB!
🔺 Resistance: $604
🔻 Support: $575 and then $505
📈 A major move is coming for BNB!
🔺 Resistance: $604
🔻 Support: $575 and then $505
Trade active
Trade closed: target reached
Related publications
Disclaimer
The information and publications are not meant to be, and do not constitute, financial, investment, trading, or other types of advice or recommendations supplied or endorsed by TradingView. Read more in the Terms of Use.
Related publications
Disclaimer
The information and publications are not meant to be, and do not constitute, financial, investment, trading, or other types of advice or recommendations supplied or endorsed by TradingView. Read more in the Terms of Use.