BNX ANALYSIS (12H)
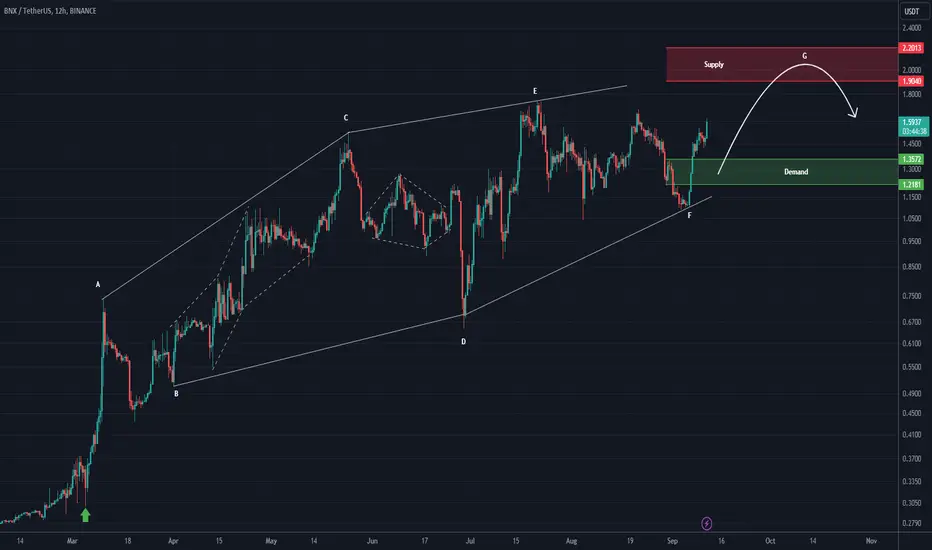
From where we placed the green arrow on the chart, it looks like a bullish BNX pattern has started.
So far, this pattern looks like a diamond diametric.
Now we seem to be in the last wave (wave G) of this pattern.
We have specified the resistance and support range on the chart.
For risk management, please don't forget stop loss and capital management
Comment if you have any questions
Thank You
So far, this pattern looks like a diamond diametric.
Now we seem to be in the last wave (wave G) of this pattern.
We have specified the resistance and support range on the chart.
For risk management, please don't forget stop loss and capital management
Comment if you have any questions
Thank You
🔆To succeed in trading, just enter our Telegram channel:
Free membership: t.me/Behdark_EN
🔷Our Telegram channel has daily spot and futures signals 👉 t.me/Behdark_EN
💎 Exclusive signals are only shared on our Telegram channel
Free membership: t.me/Behdark_EN
🔷Our Telegram channel has daily spot and futures signals 👉 t.me/Behdark_EN
💎 Exclusive signals are only shared on our Telegram channel
Disclaimer
The information and publications are not meant to be, and do not constitute, financial, investment, trading, or other types of advice or recommendations supplied or endorsed by TradingView. Read more in the Terms of Use.