Long
BarnBridge (BOND) - Bullish divergence
** warning - tiny market cap **
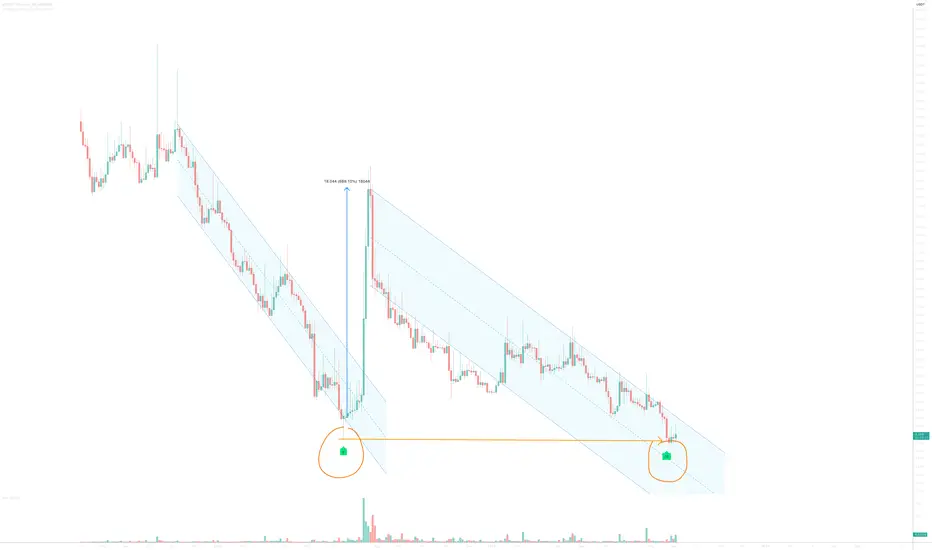
On the above 3-day chart price action has corrected 90% since June of last year. Astonishingly sellers have returned price action back to support. Is now a good time to go long?
1) Oscillators prints bullish divergence with price action. As a matter of fact more oscillators print positive divergence than the previous time price action moved from 2 dollars to 20 dollars in less than a month.
2) Price action has returned to support. Astonishing, did every buyer of the last move sell back at a lower price?
3) Some other reasons..
Is it possible price action falls further? Sure.
Is it probable? No.
Ww
Type: Trade
Risk: <= 1%
Timeframe: act now
Return: As before, around 600-700%
Trade active
It's tImeNote
now! Hard to believe sellers pushed price action below the support. This can only mean holders before the previous move to 20 dollars were compelled to sell. Awesome.
Trade active
30% 48hrs later. Who are these people that sell after a 98% drawdown? Identify yourselves!Note
Swing traders take profits after a move like that. Add again at 1.80 to 2 dolla.Note
Din't get all the was to 2 dollars, 2.5 instead.Hold until 14
Note
250% in 3 days.. no sell signal yet. Note
Gazillions of messages on this one. While I don't think the top is in the lower time frames on the Bond-BTC pair are certainly indicating signs of exhaustion.There are about 9 or 11 tokens throughout the market currently printing similar setups as far as I can tell. Does not mean the same performance as Bond shall be achieved. Will share them elsewhere..
3hr
Note
Had enough selling pressure already?Note
Before Bond blew up almost 300% there was a multiple strong signals with high divergence on the 4-5hr time frames.Only one other token is printing like this at the moment.
Will say what it is elsewhere / afterwards
Note
Absolutely loving how no one knows which way is up anymore.Volatility is returning folks and it's great. That's where the money is made.
Trade active
Resistance fails. Do you see price action pass $6 in the days ahead? Then the next resistance is $20 as per idea target.Note
Yes, nothing has changed. Hold until $20. Fear? That's the other guys problem.youtu.be/hYFViWnEq70?t=12
Note
Close short positionsTrade active
Look for price action to top out around $11.The ideas for BOND and FRONT are incredibly similar.
Note
Safe long entry, sellers have now capitulated.Trade active
Don’t often see a double “Incredible buy” signal, but when it does…This is a double high probability signal on the BOND-BTC pair 8hr chart. Last it printed price action spiked 300% in a very short space of time.
Bond.btc
The USD pair matches the same conditions on the same time frame
Bond.usd
Trade closed: stop reached
BTC
bc1q2eckdzh0q8vsd7swcc8et6ze7s99khhxyl7zwy
Weblink: patreon.com/withoutworries
Allow 3-6 months on ideas. Not investment advice. DYOR
bc1q2eckdzh0q8vsd7swcc8et6ze7s99khhxyl7zwy
Weblink: patreon.com/withoutworries
Allow 3-6 months on ideas. Not investment advice. DYOR
Disclaimer
The information and publications are not meant to be, and do not constitute, financial, investment, trading, or other types of advice or recommendations supplied or endorsed by TradingView. Read more in the Terms of Use.