Hello, greetings...
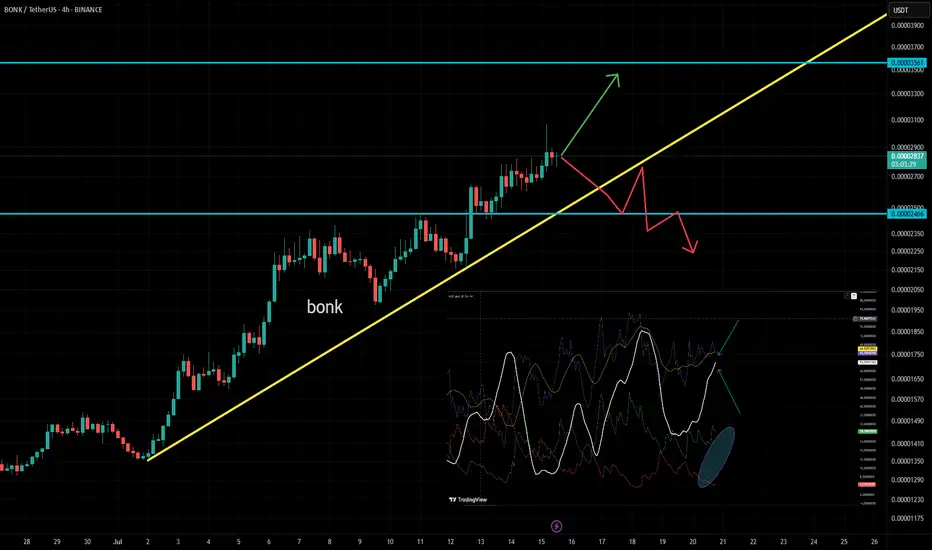
🐱🐉 The support and resistance levels in Bonk during the 4-hour timeframe are shown in the graph as I have indicated.
🐱🐉 However, what I want to discuss with you is how we should follow Bonk and how we can maintain control over its strength. I will show this to you...
🐱🏍 First, let's just look at the support, resistance, and our trend...
🐱🏍 When we look at it, we see a strong upward trend showing rapid growth and there is both a support level and a resistance level. It appears that the upward trend will continue until we reach the yellow line. When we reach the yellow trend, the color of things will change.
🐱👤 What I want to explain most to you is the indicator part now...
🐱👤 The blue arrow marks indicate the strength of the trend, the white line is called ADX, which shows how strong the trend is. The purple one is the well-known RSI,
🐱👤 So what is ADX telling us right now?
🐱👤 ADX is still looking upwards and at a high level, so it makes more sense to hold on to our long positions.
🐱🚀 The indicator we know as DI+ and DI- consists of green and red thin lines. What does it tell us?
🐱🚀 If DI+ (green) crosses above DI- (red), it indicates a positive trend and we are currently seeing a significant positive movement. We will use this indicator like this: if ADX turns downward and DI- crosses above DI+, those who are holding long positions should be cautious.
CONTINUE TO HOLD THE POSITION
+DI > -DI
ADX > 25
RSI < 70 → Should not be in an overbought area
BE CAUTIOUS
-DI > +DI
ADX > 25
RSI > 30 → Should not be in an oversold area
Disclaimer
The information and publications are not meant to be, and do not constitute, financial, investment, trading, or other types of advice or recommendations supplied or endorsed by TradingView. Read more in the Terms of Use.
Disclaimer
The information and publications are not meant to be, and do not constitute, financial, investment, trading, or other types of advice or recommendations supplied or endorsed by TradingView. Read more in the Terms of Use.