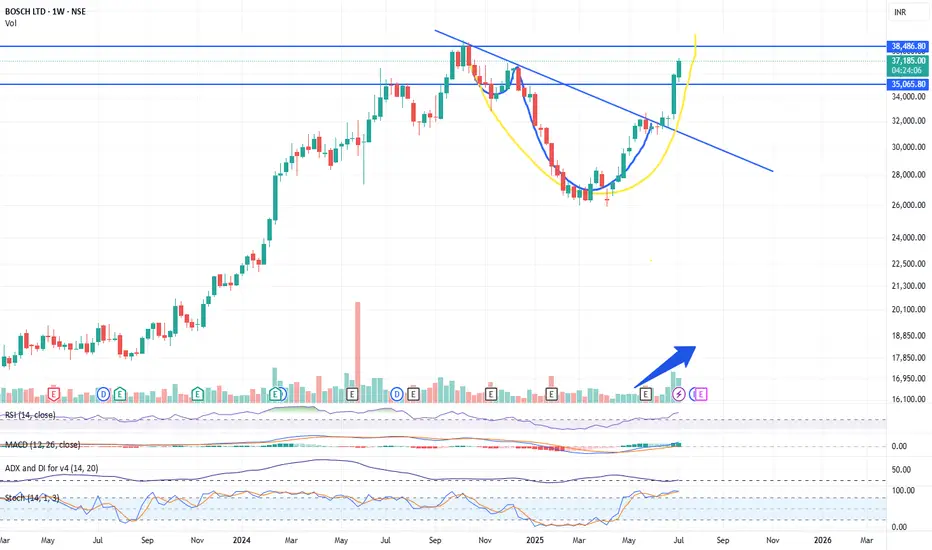
BOSCH Ltd demonstrates a strong bullish setup on the weekly chart, making it a compelling investment for the next few months. The breakout from a cup and handle pattern, supported by volume and momentum indicators, suggests the stock could outperform in the medium term. Consider a 3–6 month investment horizon, with ₹35,000 as a key support and ₹38,500–₹40,000 as the next target zone.
Key Technical Reasons
Cup and Handle Breakout
The chart displays a classic "cup and handle" pattern, a bullish continuation signal. The price has broken out above the handle resistance, suggesting the start of a new upward trend.
Strong Volume Confirmation
The breakout is accompanied by a notable increase in trading volume, which validates the strength of the move and indicates strong buying interest.
Trendline Break
The stock has decisively broken above a long-term descending trendline, signaling a shift from consolidation to a new bullish phase.
Momentum Indicators
RSI (Relative Strength Index): The RSI is above 70, indicating strong bullish momentum. While this can sometimes suggest overbought conditions, in the context of a breakout, it often signals the start of a sustained rally.
MACD: The MACD line is well above the signal line, further confirming bullish momentum.
Stochastic Oscillator: The stochastic is also in the overbought zone, which, during strong trends, can persist for extended periods.
Moving Averages
The price is trading above the 21-week EMA, reinforcing the bullish bias and indicating that the medium-term trend has turned positive.
Clear Resistance and Target Levels
The breakout level near ₹35,065 now acts as a strong support.
The next major resistance and potential target is around ₹38,486, as marked on the chart.
Suggested Investment Time Frame
Medium-Term (3–6 Months):
Given the strength of the breakout and supporting indicators, BOSCH Ltd is well-positioned for further gains over the next 3 to 6 months. The technical pattern suggests a medium-term rally towards the ₹38,500–₹40,000 zone, provided broader market conditions remain supportive.
Disclaimer
The information and publications are not meant to be, and do not constitute, financial, investment, trading, or other types of advice or recommendations supplied or endorsed by TradingView. Read more in the Terms of Use.
Disclaimer
The information and publications are not meant to be, and do not constitute, financial, investment, trading, or other types of advice or recommendations supplied or endorsed by TradingView. Read more in the Terms of Use.
