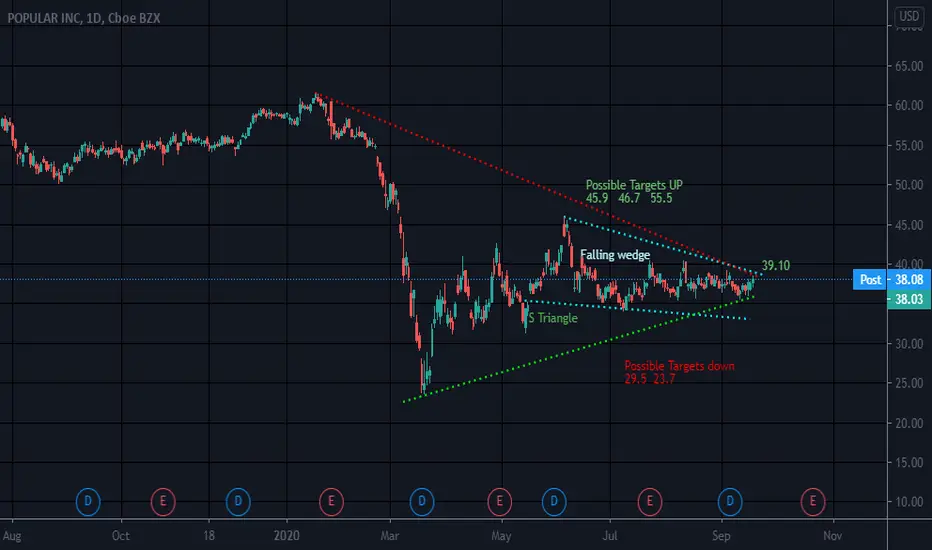
The Falling Wedge is a bullish pattern that begins wide at the top and contracts as prices move lower. This price action forms a cone that slopes down as the reaction highs and reaction lows converge. When this pattern is found in a downward trend, it is considered a reversal pattern, as the contraction of the range indicates the downtrend is losing steam.
A symmetrical triangle chart pattern represents a period of consolidation before the price is forced to breakout or breakdown. A breakdown from the lower trendline marks the start of a new bearish trend, while a breakout from the upper trendline indicates the start of a new bullish trend.
The triangle can go either way
Large effective volume and a pocket pivot today
Happy trading
Disclaimer
The information and publications are not meant to be, and do not constitute, financial, investment, trading, or other types of advice or recommendations supplied or endorsed by TradingView. Read more in the Terms of Use.
Disclaimer
The information and publications are not meant to be, and do not constitute, financial, investment, trading, or other types of advice or recommendations supplied or endorsed by TradingView. Read more in the Terms of Use.