📚 Description
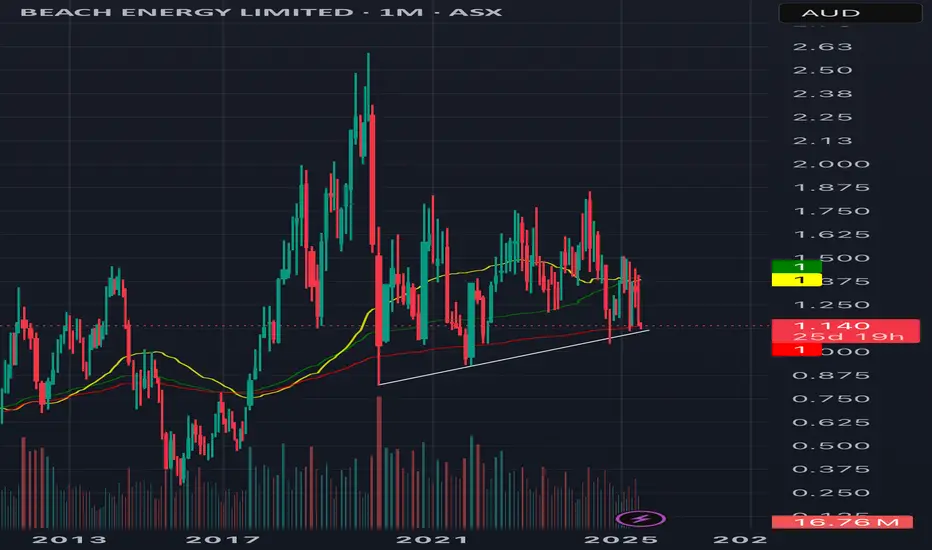
This monthly chart of Beach Energy (BPT.ASX) reveals a multi-decade compression pattern forming near historical support levels. With price currently at 1.140 AUD, the setup invites a macro-technical perspective for long-term positioning.
🔍 Key Observations
• Historical Range: Since 1991, BPT has oscillated between deep cyclical lows and explosive rallies, often tied to oil price cycles and domestic energy policy.
• Compression Zone: Price action since 2011 shows tightening volatility, forming a descending triangle with support around 1.10–1.15 AUD.
• Volume Profile: Recent monthly candles show declining volume, suggesting accumulation rather than distribution.
• Oscillators:• Momentum indicators (values: 50.97, 44.32, 15.76) show divergence — a potential early signal of reversal.
• Red and blue lines suggest a crossover setup forming, historically a precursor to trend shifts.
🌏 Macroeconomic Angle
Australia’s energy sector is undergoing a structural shift, and Beach Energy sits at the intersection of several key trends:
🛢️ Oil Price Trends
• Global oil prices remain volatile, but long-term supply constraints and geopolitical tensions (e.g., Middle East, Russia) support elevated price floors.
• BPT’s historical rallies often coincide with Brent crude surges — a macro tailwind worth monitoring.
🚢 LNG Export Dynamics
• Australia is one of the world’s top LNG exporters, and demand from Asia (Japan, South Korea, China) continues to grow.
• Beach Energy’s exposure to domestic gas and LNG infrastructure positions it to benefit from rising export volumes and favorable pricing contracts.
• Government policy shifts toward energy security and decarbonization may further support domestic producers.
📈 Inflation & Rate Cycles
• As central banks pivot from tightening to neutral or easing, energy equities often outperform due to their inflation-hedging characteristics.
• BPT’s low valuation and asset base make it a potential beneficiary of capital rotation into hard assets.
---
🧠 Educational Insight
This chart is a textbook example of long-term compression in commodity-linked equities. Traders and investors can use this to:
• Understand how macro cycles (e.g., oil prices, energy demand) reflect in equity price structure.
• Apply monthly timeframe analysis to filter out noise and identify strategic entry zones.
• Combine volume, oscillator divergence, and price structure for higher conviction setups.
🛠️ Potential Strategy
• Watch for breakout above descending resistance (~1.20 AUD) with volume confirmation.
• Risk management: Stop below historical support (~1.05 AUD).
• Target zones: 1.40 AUD (swing), 1.80 AUD (macro breakout).
Not financial advice.
Disclaimer
The information and publications are not meant to be, and do not constitute, financial, investment, trading, or other types of advice or recommendations supplied or endorsed by TradingView. Read more in the Terms of Use.
Disclaimer
The information and publications are not meant to be, and do not constitute, financial, investment, trading, or other types of advice or recommendations supplied or endorsed by TradingView. Read more in the Terms of Use.