Crude Oil Surges Amid Geopolitical Risk: Correction or Structural Rally?
Brent crude oil prices surged sharply in response to the U.S. attack on nuclear facilities in Iran, spiking to $80 per barrel in early Monday trading. Although prices later corrected toward $76.71, the threat of a potential blockade of the Strait of Hormuz — through which one-third of the world’s oil supply passes — continues to exert upward pressure on prices.
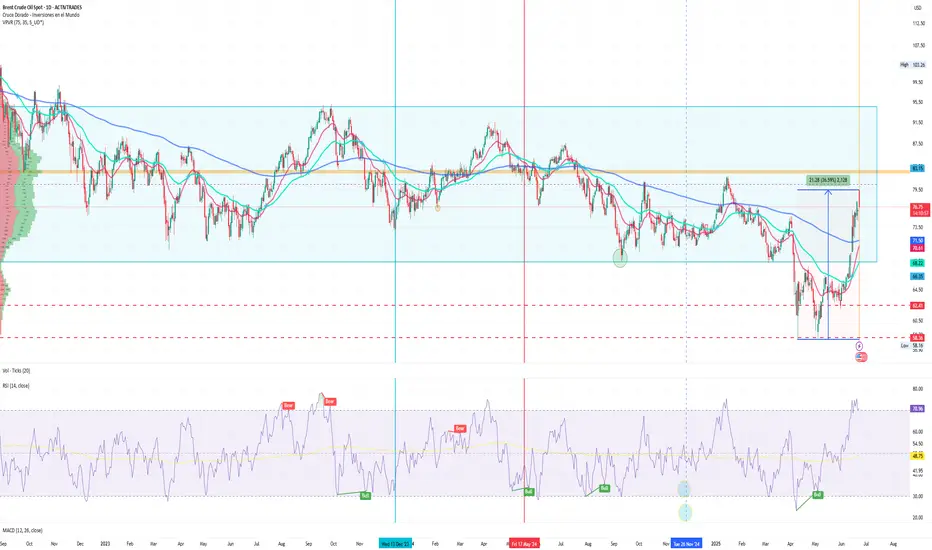
Since hitting lows near $58 per barrel in May, Brent has climbed more than 36% in just six weeks. Technically, this rally has broken through the key resistance zone around $82, a level that had served as a ceiling multiple times over the past twelve months and coincides with the midpoint of the long-term price range ($68.34–$94.93), which also includes the Point of Control (POC) of the broader value area.
Technical Highlights:
Immediate support zone: $76.50 – $75.20. This is where consolidation could occur if geopolitical tensions temporarily ease.
Next resistance: $81.82 (at the POC) – $83.50, the April 2023 highs and a historically congested area. Beyond that, $85.50 is a key level, being the most frequently traded zone in 2024.
Technical target in the event of a bullish breakout: If Brent breaks above $83.50 with volume, the next projected move could reach the $88–$90 range, where long-term resistances and Fibonacci extensions converge.
Key indicators: The RSI (Relative Strength Index) on the daily chart is in overbought territory (>70), which may prompt consolidation or technical pullbacks, albeit within a strong bullish momentum.
Market Sentiment:
The conflict has significantly boosted crude oil’s appeal as an energy safe haven. This could mark a potential “turning point,” but a swift resolution to the conflict may drive Brent back below $70. Still, any serious disruption to supply — whether from damaged overland exports to China or a blockade in the Strait of Hormuz — could catapult prices well above the previous high of $92.55.
Conclusion:
Brent crude oil currently maintains a bullish trend in both the short and medium term. However, its path remains highly volatile and subject to exogenous factors, including a potential military response from Iran and the diplomatic evolution of the Middle East conflict. A full closure of the Strait of Hormuz would act as the ultimate catalyst for another rally.
*******************************************************************************************
La información facilitada no constituye un análisis de inversiones. El material no se ha elaborado de conformidad con los requisitos legales destinados a promover la independencia de los informes de inversiones y, como tal, debe considerarse una comunicación comercial.
Toda la información ha sido preparada por ActivTrades ("AT"). La información no contiene un registro de los precios de AT, o una oferta o solicitud de una transacción en cualquier instrumento financiero. Ninguna representación o garantía se da en cuanto a la exactitud o integridad de esta información.
Cualquier material proporcionado no tiene en cuenta el objetivo específico de inversión y la situación financiera de cualquier persona que pueda recibirlo. La rentabilidad pasada no es un indicador fiable de la rentabilidad futura. AT presta un servicio exclusivamente de ejecución. En consecuencia, toda persona que actúe sobre la base de la información facilitada lo hace por su cuenta y riesgo.
Brent crude oil prices surged sharply in response to the U.S. attack on nuclear facilities in Iran, spiking to $80 per barrel in early Monday trading. Although prices later corrected toward $76.71, the threat of a potential blockade of the Strait of Hormuz — through which one-third of the world’s oil supply passes — continues to exert upward pressure on prices.
Since hitting lows near $58 per barrel in May, Brent has climbed more than 36% in just six weeks. Technically, this rally has broken through the key resistance zone around $82, a level that had served as a ceiling multiple times over the past twelve months and coincides with the midpoint of the long-term price range ($68.34–$94.93), which also includes the Point of Control (POC) of the broader value area.
Technical Highlights:
Immediate support zone: $76.50 – $75.20. This is where consolidation could occur if geopolitical tensions temporarily ease.
Next resistance: $81.82 (at the POC) – $83.50, the April 2023 highs and a historically congested area. Beyond that, $85.50 is a key level, being the most frequently traded zone in 2024.
Technical target in the event of a bullish breakout: If Brent breaks above $83.50 with volume, the next projected move could reach the $88–$90 range, where long-term resistances and Fibonacci extensions converge.
Key indicators: The RSI (Relative Strength Index) on the daily chart is in overbought territory (>70), which may prompt consolidation or technical pullbacks, albeit within a strong bullish momentum.
Market Sentiment:
The conflict has significantly boosted crude oil’s appeal as an energy safe haven. This could mark a potential “turning point,” but a swift resolution to the conflict may drive Brent back below $70. Still, any serious disruption to supply — whether from damaged overland exports to China or a blockade in the Strait of Hormuz — could catapult prices well above the previous high of $92.55.
Conclusion:
Brent crude oil currently maintains a bullish trend in both the short and medium term. However, its path remains highly volatile and subject to exogenous factors, including a potential military response from Iran and the diplomatic evolution of the Middle East conflict. A full closure of the Strait of Hormuz would act as the ultimate catalyst for another rally.
*******************************************************************************************
La información facilitada no constituye un análisis de inversiones. El material no se ha elaborado de conformidad con los requisitos legales destinados a promover la independencia de los informes de inversiones y, como tal, debe considerarse una comunicación comercial.
Toda la información ha sido preparada por ActivTrades ("AT"). La información no contiene un registro de los precios de AT, o una oferta o solicitud de una transacción en cualquier instrumento financiero. Ninguna representación o garantía se da en cuanto a la exactitud o integridad de esta información.
Cualquier material proporcionado no tiene en cuenta el objetivo específico de inversión y la situación financiera de cualquier persona que pueda recibirlo. La rentabilidad pasada no es un indicador fiable de la rentabilidad futura. AT presta un servicio exclusivamente de ejecución. En consecuencia, toda persona que actúe sobre la base de la información facilitada lo hace por su cuenta y riesgo.
Disclaimer
The information and publications are not meant to be, and do not constitute, financial, investment, trading, or other types of advice or recommendations supplied or endorsed by TradingView. Read more in the Terms of Use.
Disclaimer
The information and publications are not meant to be, and do not constitute, financial, investment, trading, or other types of advice or recommendations supplied or endorsed by TradingView. Read more in the Terms of Use.