Structure & momentum
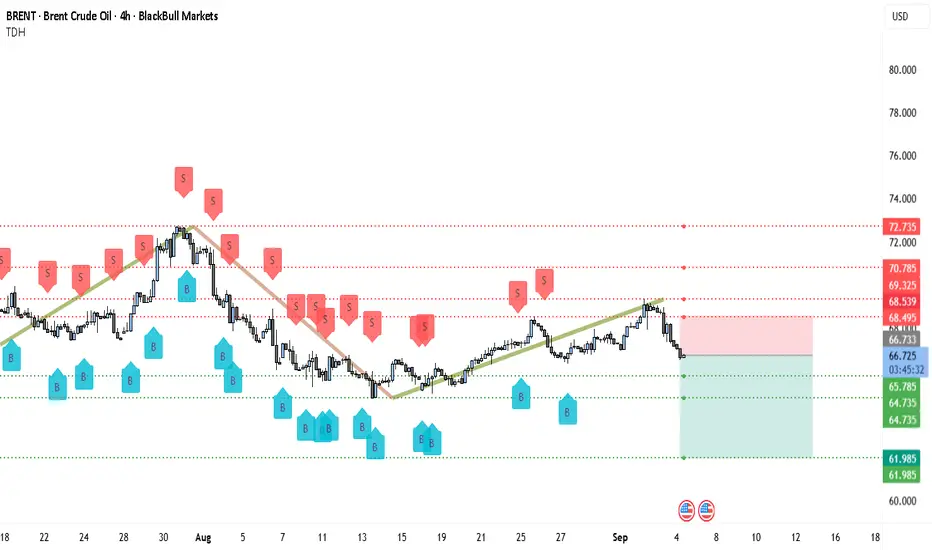
Price completed a three-leg climb into late August but failed beneath a thick supply band clustered around 68.50 → 69.30 and again lower-high’d under 70.80. The last push up rode a rising support line; that line has now broken, followed by two wide-range sell candles closing near their lows—classic momentum expansion after a trendline break. The repeated red “S” clusters over the same band reinforce where offers sit and where rallies have been sold.
Levels that matter
• Overhead supply / invalidation:
First layer at 68.50–68.55 (breakdown pivot), then 69.33, and the stronger cap near 70.78. Acceptance back above 68.55 would be your first caution; sustained closes over 69.33 would neutralize the short and put 70.78 / 72.74 back in play.
• Immediate pivot: 66.73. Price is pressing this prior support; losing it turns the path of least resistance lower.
• Downside magnets / demand layers: 65.79, 64.74, and the deeper 61.98 base. These align with prior reaction lows and liquidity pools where buyers previously defended.
Why the bias is bearish (now)
• Lower high into supply (failed to clear 69s) + rising trendline break = change of character on 4H.
• Momentum follow-through: consecutive strong bearish bodies suggest sellers in control rather than a single news spike.
• Clean downside structure: stair-stepped supports below (66.73 → 65.79 → 64.74 → 61.98) provide logical profit-taking waypoints and reduce the odds of “vacuum” reversals.
Risk catalysts to respect
The chart flags upcoming US energy data windows—inventory releases can create sharp, temporary squeezes against trend. Size accordingly and expect slippage during those prints.
________________________________________
📉 Trade setup (bearish)
• Entry (Option A – continuation): Short on a 4H close below 66.73, or on a minor pullback that rejects 66.73 from underneath.
o Stop: 68.55
o T1: 65.79 (take ~30%)
o T2: 64.74 (take ~40%)
o T3: 61.98 (runner)
o Approx. R:R from 66.73 → 68.55 / 61.98: ~1 : 2.7
• Entry (Option B – sell the rip): Preferable risk if price bounces into 67.90–68.40 and prints rejection.
o Stop: 69.33
o T1: 66.73
o T2: 65.79
o T3: 64.74 / 61.98
Trade management: After T1, move the stop to breakeven. From there, trail above each 4H lower high (or ~1.5×ATR above price) to stay in the trend while protecting open profit. If momentum accelerates through 64.74, tighten the trail to lock in gains on the runner.
________________________________________
Invalidation & alternate path
A decisive 4H close back above 68.55 is your yellow flag; above 69.33 the bearish thesis weakens materially and favors a broader squeeze toward 70.78 and possibly 72.74. Until then, rallies into 68s remain sell zones.
Bottom line: The market has rotated from a rising correction into distribution below 69s, broken trendline support, and is now threatening 66.73. Fading bounces or selling the breakdown targets 65.79 → 64.74 → 61.98 with disciplined partials and a trailing stop.
Trade active
Subject to your risk appetite, start booking "Partial Profits" and Set Your SL to Breakeven. Trade forex, indices, stocks and metals with up to US$100.000 in company's funding.
Complete a challenge to access funding or go for instant deposit.
Trading involves substantial risk. Not financial advice
Complete a challenge to access funding or go for instant deposit.
Trading involves substantial risk. Not financial advice
Disclaimer
The information and publications are not meant to be, and do not constitute, financial, investment, trading, or other types of advice or recommendations supplied or endorsed by TradingView. Read more in the Terms of Use.
Trade forex, indices, stocks and metals with up to US$100.000 in company's funding.
Complete a challenge to access funding or go for instant deposit.
Trading involves substantial risk. Not financial advice
Complete a challenge to access funding or go for instant deposit.
Trading involves substantial risk. Not financial advice
Disclaimer
The information and publications are not meant to be, and do not constitute, financial, investment, trading, or other types of advice or recommendations supplied or endorsed by TradingView. Read more in the Terms of Use.