Long
Oil Prices Surge Following Armed Conflict Between Israel and Ira
In the early hours of Friday, June 13, a new turning point in global geopolitics emerged and extended through the weekend: Israel launched an aerial attack using missiles and drones on Iranian nuclear facilities, triggering an immediate reaction in energy markets. The conflict has continued throughout the weekend, resulting in casualties on both sides, including significant losses within the Iranian military hierarchy. Brent crude spiked intraday by 13%, closing at $75.40—its highest jump in five years. West Texas Intermediate (WTI) also surged to $74, erasing its year-to-date losses. As of today, this upward movement appears to have paused temporarily.
Technical Analysis
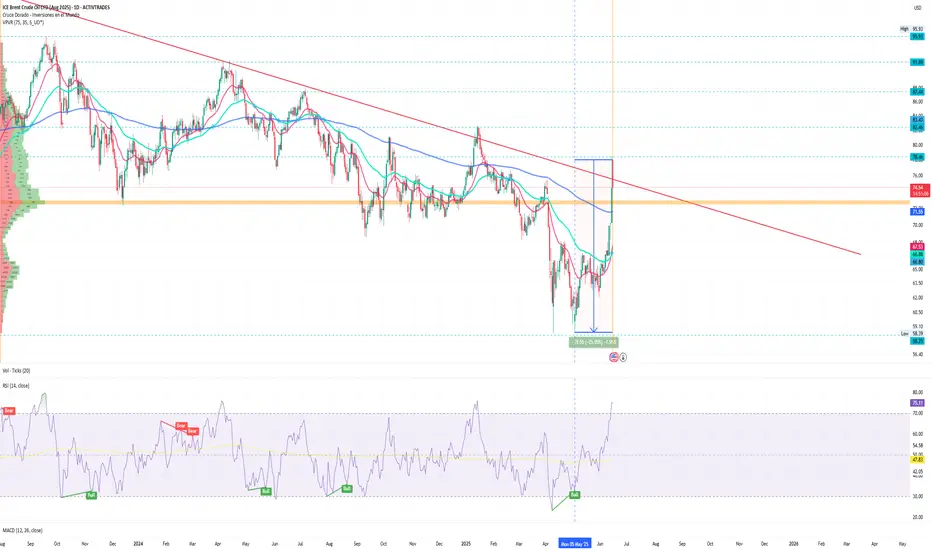
From a technical perspective, Brent broke through the key resistance level of $74 and began the week reaching a peak of $78.46, opening the door to a potential bullish extension toward the psychological $80 level. The Relative Strength Index (RSI) is now above 70 on daily charts, starting the week at 75.33%, indicating overbought conditions—albeit justified by the sudden spike in geopolitical risk. On the weekly candles, the price has broken out of a bearish consolidation pattern that had persisted since March. A weekly close above current psychological resistance highs could confirm a trend reversal if prices break through the $82.60 resistance during the week.
Today’s Asian session showed signs of a technical ceiling, with a red candle at the session open failing to surpass Friday’s highs, indicating weakness and pushing the 1-hour RSI down to around 56%. Since early May, oil has risen approximately 25%, suggesting a potentially revitalized trend. Looking at moving average crossovers, the 50-period MA has crossed above the 100-period MA, signaling the beginning of an uptrend. If this is confirmed by a cross above the 200 MA this week, prices could recover toward $96, assuming resistance levels are breached.
Bearish pressure during the Asian session is largely attributed to U.S. pressure on oil prices. The point of control has remained significantly below current prices—around $72–73—forming a wide bell-shaped profile concentrated in that range, where prices have traded most frequently since late last year.
Fundamental Analysis
The driver behind this sharp move is clear: the market is pricing in the potential closure of the Strait of Hormuz, through which approximately 20% of the world’s oil flows. Any disruption in this strategic chokepoint would dramatically increase logistical costs and the risk of short-term shortages.
Banks like JP Morgan warn that a total closure—although unlikely—could send crude prices as high as $130 per barrel. Currently, they estimate a 7% probability of such an outcome, but even a partial escalation is enough to maintain an elevated risk premium. U.S. weekly crude inventories also fell more than expected (-3.8 million barrels), adding further upward pressure. These tensions arise just as OPEC+ had begun to ease its production cuts. Current volatility may force a strategic rethink within the cartel, with emergency meetings possible if the Middle East crisis worsens.
Impact on Energy and Macroeconomic Markets
The immediate surge in oil prices reflects not only fears of physical supply disruption but also a reassessment of "tail risks"—now considered more plausible—such as a partial or full closure of the Strait of Hormuz. This scenario fuels a structural geopolitical premium that could persist for weeks or even months if the escalation continues.
The response among listed oil companies has been mixed. Giants like ExxonMobil and Chevron saw immediate share price increases, while more regionally exposed firms such as TotalEnergies and BP showed greater volatility. Meanwhile, crude oil shipping companies like Frontline or Euronav may benefit from longer, costlier, but potentially more profitable freight routes.
Persistently high oil prices could challenge expectations of interest rate cuts by the Federal Reserve and the European Central Bank, potentially sparking a new inflationary wave in the energy component. This could lead to unexpectedly tighter global financial conditions, especially in energy-dependent economies.
Net energy importers—such as India, Japan, or much of the eurozone—could see their trade balances worsen and currencies weaken, while exporters like Saudi Arabia, Russia, or even Venezuela could gain fiscal and political strength.
Global Repercussions
The conflict between Israel and Iran represents a new inflection point for the oil market. Its trajectory will be critical for commodities, capital flows, and monetary policy throughout the second half of the year.
Technically, the $96 per barrel zone becomes increasingly likely if the conflict drags on. Fundamentally, a strategic realignment among multilateral organizations and producers seems imminent, possibly ushering in a new phase of higher and more volatile oil prices.
The key lies in two factors: Iran’s response and the stance of the United States, which has condemned the attack but has yet to take direct military action. If Washington becomes actively involved, the impact could be far more profound—economically and geopolitically—and markets are beginning to price in that risk.
The conflict also threatens to derail diplomatic efforts between Tehran and Washington, which had recently resumed with the goal of reviving the 2015 nuclear deal. The attack has frozen those talks and prompted Iran to announce severe retaliatory measures, adding another layer of uncertainty for global markets.
Investors have responded by shifting clearly toward safe-haven assets such as gold, which rose more than 2% during the session, and the U.S. dollar, which regained ground against major emerging market currencies.
*******************************************************************************************
The information provided does not constitute investment research. The material has not been prepared in accordance with the legal requirements designed to promote the independence of investment research and such should be considered a marketing communication.
All information has been prepared by ActivTrades ("AT"). The information does not contain a record of AT's prices, or an offer of or solicitation for a transaction in any financial instrument. No representation or warranty is given as to the accuracy or completeness of this information.
Any material provided does not have regard to the specific investment objective and financial situation of any person who may receive it. Past performance is not reliable indicator of future performance. AT provides an execution-only service. Consequently, any person acting on the information provided does so at their own risk.
Disclaimer
The information and publications are not meant to be, and do not constitute, financial, investment, trading, or other types of advice or recommendations supplied or endorsed by TradingView. Read more in the Terms of Use.
Disclaimer
The information and publications are not meant to be, and do not constitute, financial, investment, trading, or other types of advice or recommendations supplied or endorsed by TradingView. Read more in the Terms of Use.