Firstly, our Algo-based indicators are used to create this analysis:
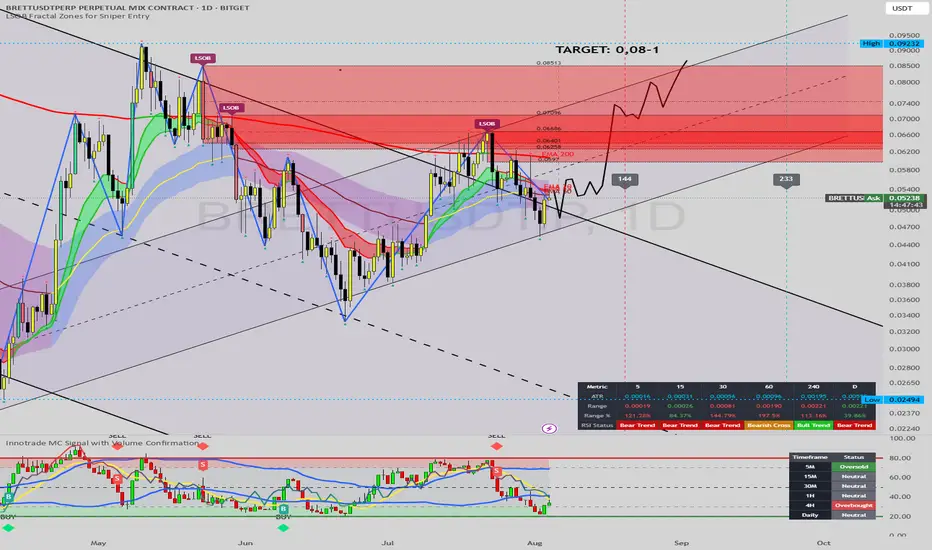
This daily chart for BRETTUSDT suggests a developing bullish scenario following a key technical breakout.
Analysis:
Channel Support: The price is trading within a broad ascending parallel channel. It has recently respected the lower boundary of this channel, finding solid support and bouncing off it, which indicates a potential continuation of the larger uptrend.
Trendline Breakout: A significant descending trendline that was previously acting as resistance has been broken. The price is currently hovering just above this line, which appears to be a classic breakout-and-retest pattern. A successful hold above this line would serve as strong confirmation for further upside.
Indicator Signal: The custom indicator at the bottom of the chart shows the price moving out of the "oversold" territory. The projected path of the indicator is pointing upwards, suggesting building bullish momentum that aligns with the price action.
Price Projection: The drawn red line illustrates a potential path for the price, anticipating a move upwards towards the upper resistance of the ascending channel.
Strategy:
Entry: The current price level (around $0.052) could be considered an entry zone, as it represents a successful retest of the broken trendline.
Target: The primary target for this bullish move is clearly marked between $0.08 and $0.10. This level aligns with the upper boundary of the long-term ascending channel.
Conclusion:
With multiple technical factors pointing in the same direction—a bounce from channel support, a breakout and retest of a key trendline, and a supporting indicator signal—the outlook for BRETTUSDT appears bullish. The next major objective for the bulls is the 0.08−0.10 resistance area.
Disclaimer: This analysis is for educational purposes only and should not be considered financial advice. Always conduct your own research and manage risk appropriately.
Disclaimer
The information and publications are not meant to be, and do not constitute, financial, investment, trading, or other types of advice or recommendations supplied or endorsed by TradingView. Read more in the Terms of Use.
Disclaimer
The information and publications are not meant to be, and do not constitute, financial, investment, trading, or other types of advice or recommendations supplied or endorsed by TradingView. Read more in the Terms of Use.