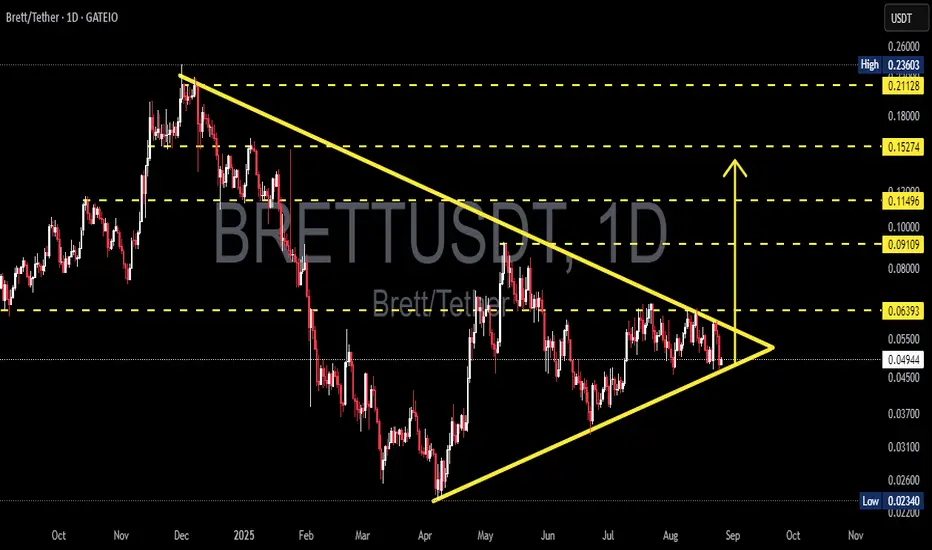
BRETT/USDT is currently forming a symmetrical triangle pattern on the Daily timeframe (1D). This structure is shaped by lower highs (selling pressure) and higher lows (buying pressure), which are now converging near the apex zone (0.049–0.064). As price approaches the tip of the triangle, volatility often expands sharply, leading to a major directional breakout.
---
🔹 Pattern & Key Levels
Pattern: Symmetrical Triangle (neutral — can break either way).
Strong Support: 0.045 – 0.049
Key Resistance: 0.064
Major Horizontal Levels:
0.091 → mid resistance
0.115 → strong resistance
0.152 → psychological zone
0.211 – 0.236 → previous highs
Lower Supports: 0.037 / 0.031 / 0.026 / 0.023
---
🚀 Bullish Scenario
1. Breakout confirmation if daily close happens above 0.064 with strong volume.
2. A successful retest of 0.064 as support will further strengthen the bullish setup.
3. Upside targets:
TP1 = 0.091
TP2 = 0.115
TP3 = 0.152
Measured move projection (long-term potential) = ~0.277
4. Stop-loss idea: below 0.049 or under the lower trendline.
---
🔻 Bearish Scenario
1. Breakdown confirmation if daily close happens below 0.045.
2. Failed retest of 0.045–0.049 as resistance would confirm further downside.
3. Downside targets:
TP1 = 0.037
TP2 = 0.031
TP3 = 0.026
Final strong support = 0.0234
4. Stop-loss idea: above 0.058–0.064 (upper trendline zone).
---
⚖️ Conclusion
BRETT/USDT is approaching a critical decision zone. The symmetrical triangle shows market compression — pressure is building up for a powerful breakout.
A bullish breakout above 0.064 could fuel a rally toward 0.091 – 0.152 and potentially higher.
A bearish breakdown below 0.045 may trigger a correction toward 0.026 – 0.023.
Best strategy: Wait for breakout confirmation with daily close + volume, apply strict stop-losses, and take profits step by step at key levels.
#BRETTUSDT #BRETT #AltcoinAnalysis #CryptoBreakout #TechnicalAnalysis #SymmetricalTriangle #ChartPattern #CryptoTA #SupportResistance
---
🔹 Pattern & Key Levels
Pattern: Symmetrical Triangle (neutral — can break either way).
Strong Support: 0.045 – 0.049
Key Resistance: 0.064
Major Horizontal Levels:
0.091 → mid resistance
0.115 → strong resistance
0.152 → psychological zone
0.211 – 0.236 → previous highs
Lower Supports: 0.037 / 0.031 / 0.026 / 0.023
---
🚀 Bullish Scenario
1. Breakout confirmation if daily close happens above 0.064 with strong volume.
2. A successful retest of 0.064 as support will further strengthen the bullish setup.
3. Upside targets:
TP1 = 0.091
TP2 = 0.115
TP3 = 0.152
Measured move projection (long-term potential) = ~0.277
4. Stop-loss idea: below 0.049 or under the lower trendline.
---
🔻 Bearish Scenario
1. Breakdown confirmation if daily close happens below 0.045.
2. Failed retest of 0.045–0.049 as resistance would confirm further downside.
3. Downside targets:
TP1 = 0.037
TP2 = 0.031
TP3 = 0.026
Final strong support = 0.0234
4. Stop-loss idea: above 0.058–0.064 (upper trendline zone).
---
⚖️ Conclusion
BRETT/USDT is approaching a critical decision zone. The symmetrical triangle shows market compression — pressure is building up for a powerful breakout.
A bullish breakout above 0.064 could fuel a rally toward 0.091 – 0.152 and potentially higher.
A bearish breakdown below 0.045 may trigger a correction toward 0.026 – 0.023.
Best strategy: Wait for breakout confirmation with daily close + volume, apply strict stop-losses, and take profits step by step at key levels.
#BRETTUSDT #BRETT #AltcoinAnalysis #CryptoBreakout #TechnicalAnalysis #SymmetricalTriangle #ChartPattern #CryptoTA #SupportResistance
✅ Get Free Signals! Join Our Telegram Channel Here: t.me/TheCryptoNuclear
✅ Twitter: twitter.com/crypto_nuclear
✅ Join Bybit : partner.bybit.com/b/nuclearvip
✅ Benefits : Lifetime Trading Fee Discount -50%
✅ Twitter: twitter.com/crypto_nuclear
✅ Join Bybit : partner.bybit.com/b/nuclearvip
✅ Benefits : Lifetime Trading Fee Discount -50%
Disclaimer
The information and publications are not meant to be, and do not constitute, financial, investment, trading, or other types of advice or recommendations supplied or endorsed by TradingView. Read more in the Terms of Use.