The crypto market is heating up again, and BRETT/USDT is showing one of the most promising technical setups right now. The pair is approaching a critical breakout point from a well-defined Symmetrical Triangle, signaling that a major move may be imminent.
🧠 Technical Pattern: Symmetrical Triangle – Price Compression at Its Peak
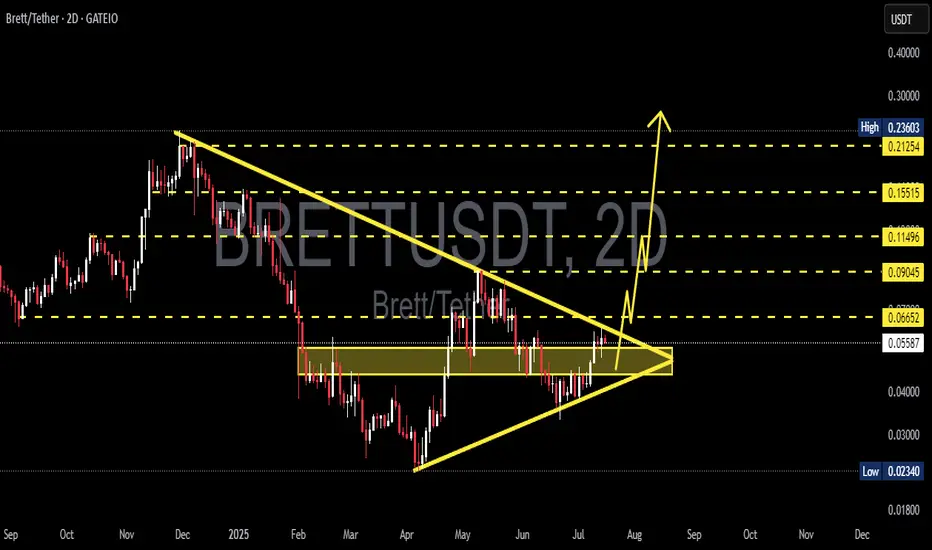
Since February 2025, BRETT/USDT has been consolidating inside a Symmetrical Triangle – a classic neutral pattern that often precedes explosive moves.
Key Characteristics:
Lower highs & higher lows: A sign of price compression and indecision
Trendline convergence: A breakout or breakdown is imminent
Decreasing volume: A textbook pre-breakout condition
Currently, the price is trading around $0.05595, right near the triangle’s resistance line – putting it at a make-or-break moment.
✅ Bullish Scenario – Breakout and Rally
If the price breaks out above the triangle resistance with strong volume and a daily candle close, we could witness a rapid rally toward multiple key resistance levels:
📈 Bullish Targets:
1. $0.06652 – Initial breakout confirmation
2. $0.09045 – Minor horizontal resistance
3. $0.11496 – Mid-term resistance level
4. $0.15515 – Historical supply zone
5. $0.21254 – $0.23603 – Full pattern target and previous local high
🚀 From the current price, this breakout could deliver over +300% upside if momentum holds.
Indicators like RSI, MACD, and Volume Spike confirmation can act as supporting evidence for entry.
❌ Bearish Scenario – Breakdown and Continuation
On the flip side, failure to break out and a drop below the lower support trendline could signal a bearish continuation of the previous downtrend.
📉 Bearish Targets:
$0.04000 – Minor support level
$0.02340 – Cycle low & strong horizontal support
🔻 Such a breakdown would invalidate the bullish setup and may lead to prolonged consolidation or further downside.
🧩 Summary & Market Insight
BRETT/USDT is at a highly pivotal technical level. The symmetrical triangle pattern suggests that a major breakout or breakdown is imminent, and the reward-to-risk ratio is very attractive for both swing traders and position traders.
📌 Trading Strategy Suggestions:
Bullish: Enter on confirmed breakout above triangle with volume; stop-loss below previous support.
Bearish: Watch for breakdown with volume; consider short targets or wait for new support to form.
Always apply proper risk management and consider using trailing stops in case of strong continuation.
#BRETTUSDT #CryptoBreakout #AltcoinAnalysis #SymmetricalTriangle #CryptoTechnicalAnalysis #Altcoins #BreakoutSetup #CryptoTraders #CryptoMarketUpdate
🧠 Technical Pattern: Symmetrical Triangle – Price Compression at Its Peak
Since February 2025, BRETT/USDT has been consolidating inside a Symmetrical Triangle – a classic neutral pattern that often precedes explosive moves.
Key Characteristics:
Lower highs & higher lows: A sign of price compression and indecision
Trendline convergence: A breakout or breakdown is imminent
Decreasing volume: A textbook pre-breakout condition
Currently, the price is trading around $0.05595, right near the triangle’s resistance line – putting it at a make-or-break moment.
✅ Bullish Scenario – Breakout and Rally
If the price breaks out above the triangle resistance with strong volume and a daily candle close, we could witness a rapid rally toward multiple key resistance levels:
📈 Bullish Targets:
1. $0.06652 – Initial breakout confirmation
2. $0.09045 – Minor horizontal resistance
3. $0.11496 – Mid-term resistance level
4. $0.15515 – Historical supply zone
5. $0.21254 – $0.23603 – Full pattern target and previous local high
🚀 From the current price, this breakout could deliver over +300% upside if momentum holds.
Indicators like RSI, MACD, and Volume Spike confirmation can act as supporting evidence for entry.
❌ Bearish Scenario – Breakdown and Continuation
On the flip side, failure to break out and a drop below the lower support trendline could signal a bearish continuation of the previous downtrend.
📉 Bearish Targets:
$0.04000 – Minor support level
$0.02340 – Cycle low & strong horizontal support
🔻 Such a breakdown would invalidate the bullish setup and may lead to prolonged consolidation or further downside.
🧩 Summary & Market Insight
BRETT/USDT is at a highly pivotal technical level. The symmetrical triangle pattern suggests that a major breakout or breakdown is imminent, and the reward-to-risk ratio is very attractive for both swing traders and position traders.
📌 Trading Strategy Suggestions:
Bullish: Enter on confirmed breakout above triangle with volume; stop-loss below previous support.
Bearish: Watch for breakdown with volume; consider short targets or wait for new support to form.
Always apply proper risk management and consider using trailing stops in case of strong continuation.
#BRETTUSDT #CryptoBreakout #AltcoinAnalysis #SymmetricalTriangle #CryptoTechnicalAnalysis #Altcoins #BreakoutSetup #CryptoTraders #CryptoMarketUpdate
✅ Get Free Signals! Join Our Telegram Channel Here: t.me/TheCryptoNuclear
✅ Twitter: twitter.com/crypto_nuclear
✅ Join Bybit : partner.bybit.com/b/nuclearvip
✅ Benefits : Lifetime Trading Fee Discount -50%
✅ Twitter: twitter.com/crypto_nuclear
✅ Join Bybit : partner.bybit.com/b/nuclearvip
✅ Benefits : Lifetime Trading Fee Discount -50%
Disclaimer
The information and publications are not meant to be, and do not constitute, financial, investment, trading, or other types of advice or recommendations supplied or endorsed by TradingView. Read more in the Terms of Use.