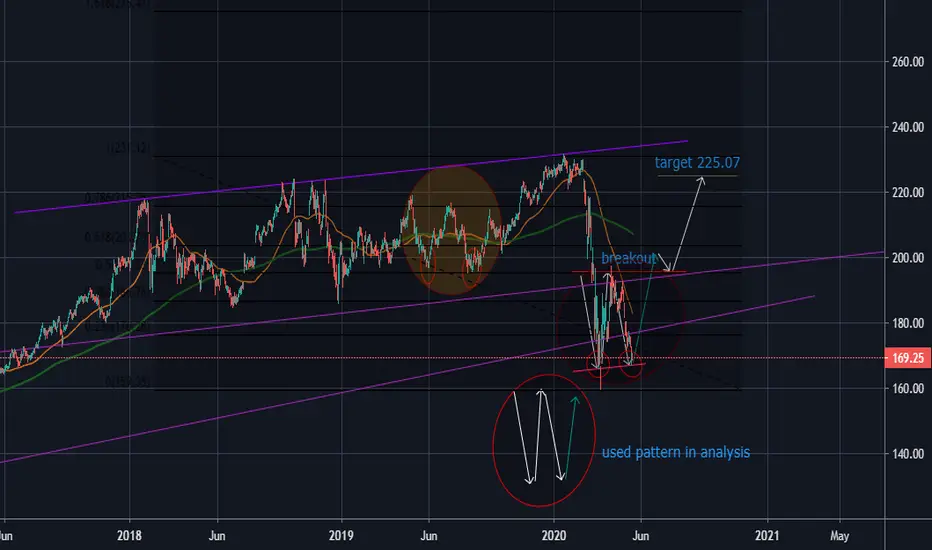
hello friends ! i found bullish pattern in berkshire hathaway daily chart that we called double bottom pattern !
the target was showed in the picture ! if the breakpoint from bottom happend !! the analysis failed and the trend change to bearish from bullish
hope it was useful for you my friends .
#berkshirehathaway #stock #wallstreet #stockmarket #nyse
 BRK.B
BRK.B
the target was showed in the picture ! if the breakpoint from bottom happend !! the analysis failed and the trend change to bearish from bullish
hope it was useful for you my friends .
#berkshirehathaway #stock #wallstreet #stockmarket #nyse
Note
now we can see the pattern is getting completedDisclaimer
The information and publications are not meant to be, and do not constitute, financial, investment, trading, or other types of advice or recommendations supplied or endorsed by TradingView. Read more in the Terms of Use.
Disclaimer
The information and publications are not meant to be, and do not constitute, financial, investment, trading, or other types of advice or recommendations supplied or endorsed by TradingView. Read more in the Terms of Use.