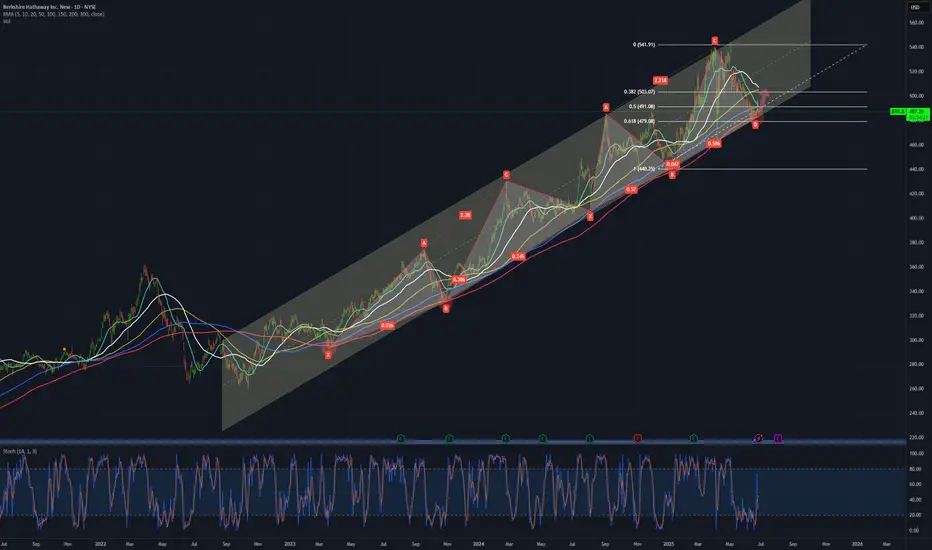
The chart shows a bullish trend as the price action bounces off the 0.618 Fibonacci retracement level and finds strong support at the MA200 (red line). The presence of an XABCD harmonic pattern further reinforces the potential for continued upward momentum.
Disclaimer
The information and publications are not meant to be, and do not constitute, financial, investment, trading, or other types of advice or recommendations supplied or endorsed by TradingView. Read more in the Terms of Use.
Disclaimer
The information and publications are not meant to be, and do not constitute, financial, investment, trading, or other types of advice or recommendations supplied or endorsed by TradingView. Read more in the Terms of Use.